Debug Jscript with Internet Explorer 8
As a developer a big pain was (after reading this it will be no more J) troubleshooting JavaScript errors. Internet Explorer has never been a big friend in helping me looking at these issues … this is, until Internet Explorer 8. When the first beta came out, I was very enthusiastic to try the Developer Tools, and must confess I was not disappointed with the outcome.
I believe that you will understand this enthusiasm soon. So, because of this I decided to talk a bit about the tool. It does not only allow you to debug Jscript but also HTML, CSS and you have the Profiler (For now I will only talk about Jscript but in the future I will mention the Profiler).
To start, you can press F12 or go to Tools menu and open the Developer Tools. It will show you a window similar to the one below (since i´m using beta 2, I can´t guarantee this will be the final outcome).
You will notice four tabs: HTML, CSS, Script, Profiler. Click on Script tab and you will see something like the picture below.
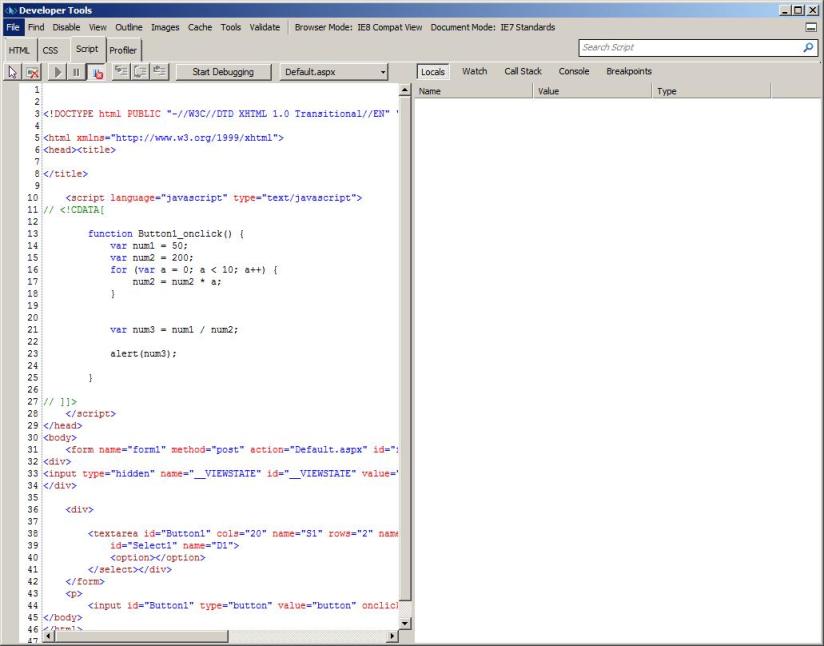
The first step to start debugging is to press the “Start Debugging” button (don´t worry if disable script debugging settings are defined in IE. The debugger will re-enable it just for the purpose of this session. IE will ask you to refresh the page).
You will notice that the way you will debug is very similar to what Visual Studio allows you to do. On the left, you will see the source code and line number. To set breakpoints you can press near the line number or with the right button and select “Insert Breakpoint”. Like in Visual Studio, after a breakpoint is defined you will see it in red. Clicking again on the red circle will remove the breakpoint. Also we can define simple conditions on breakpoint by pressing on the mouse right button (on a selected breakpoint) and select “Condition…”.
On the right you can also see all breakpoints that are defined by selecting “Breakpoints” tab. All the operations I specified earlier can be done also in this window.
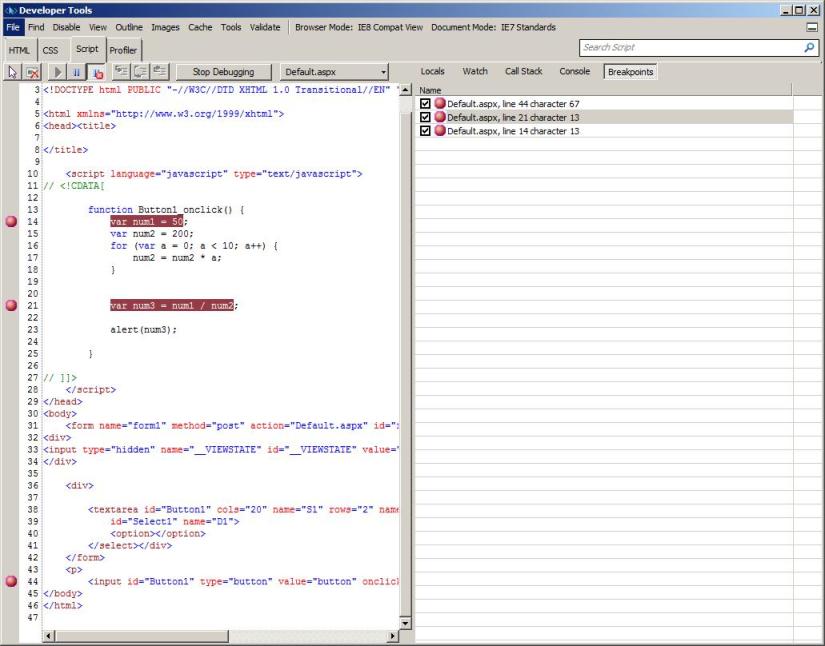
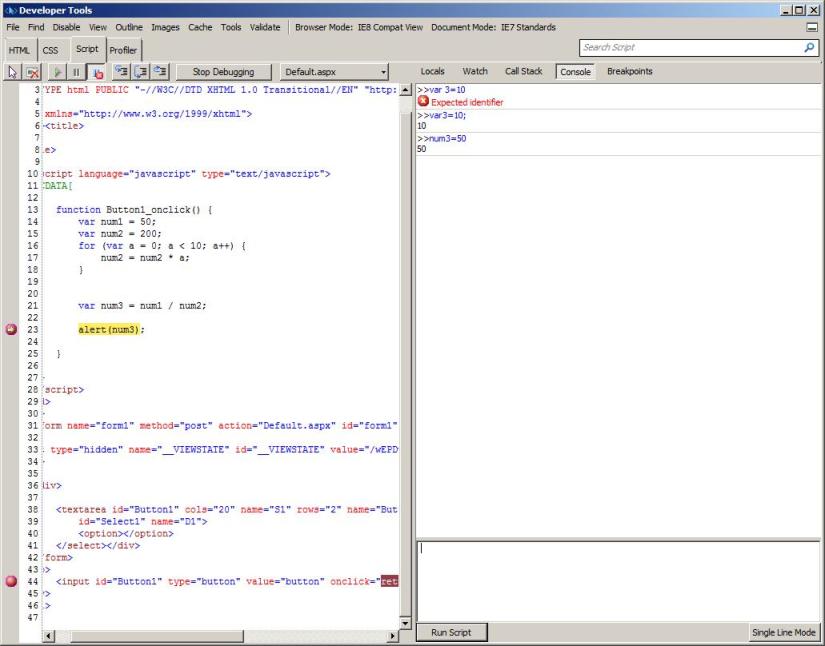
When a breakpoint is hit, the next line to be executed will show up in yellow and no user interaction will be possible. From here you can control execution like you would do in Visual Studio. Options are:
· Continue
· Step Over
· Step Into
· Step Out
These options are available in the toolbar

On the right you can look at locals and their values. Just select the locals tab.
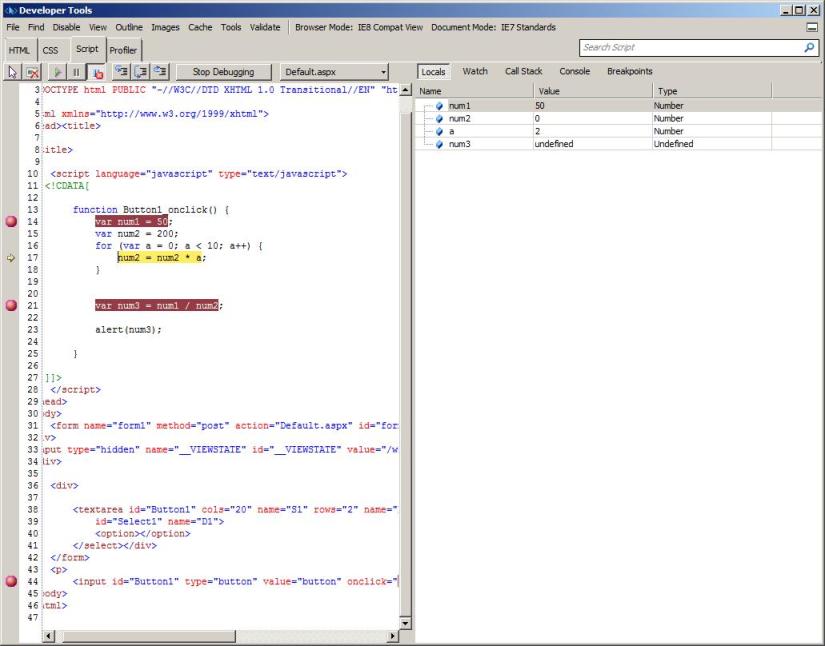
On the picture above you can see the yellow line showing the next statement that is going to be executed.
Also you can change the variable values. Press with the mouse right button on Value and change it. If you variable are a complex one a plus sign shows up and drill down will be possible. Every time a statement is executed and the variable value changes it will show up in red.
The Watch tab allows you to define a list of variables to watch for. Just click with the mouse right button and select “Add Watch”.
The Call Stack tab lets you look at the call stack and variables. Just select the line in the call stack tab and select the locals or watch tab.
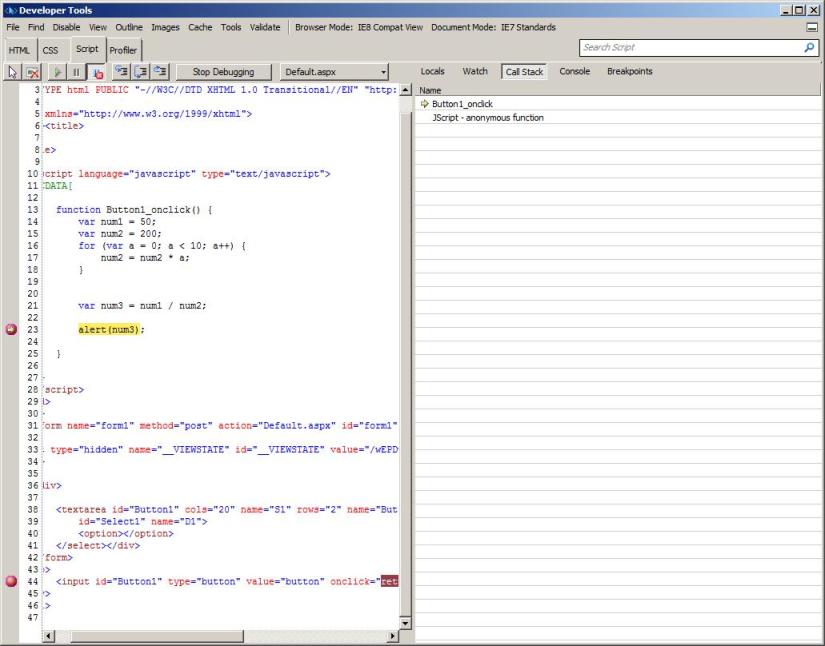
Finally the Console tab (it´s the equivalent to Visual Studio Immediate Window) allows you to run custom scripts in the execution context.
In conclusion, I think this is a huge improvement to us all that develop web applications and need troubleshoot issues with Jscript.
Next time I will talk about the Profiler and how it can help you troubleshooting bootlenecks.
Have Fun!!!
Bruno
Comments
Anonymous
October 08, 2008
My team has started a blog. Since we all have different skills, it will be more generalist and thereAnonymous
October 11, 2008
.NET ASP.NETMVCandthenewIIS7RewriteModule My10commonmistakesinASP.NET C#CodingS...