Microsoft Band on the Run - the architecture
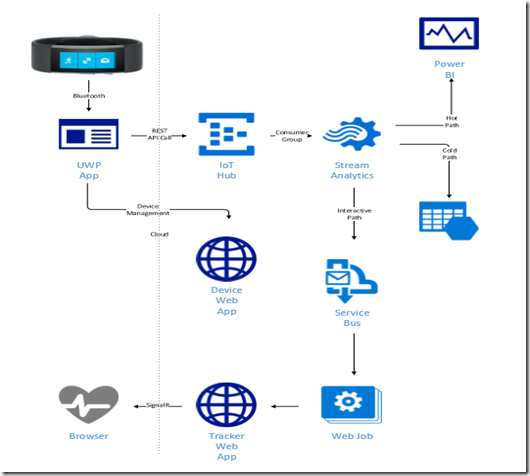
Hot on the heels of our session at the Wearable technology Show 2016 #wts2016, we decided to sort out the “Microsoft Band on the Run” documentation, and have started with a high level diagram that shows how the various moving bits fit together:
The UWP app connects via bluetooth,using the Microsoft Band SDK, to the band to get real time sensor data.
When the app first connects to a band, it gets a special Azure IoT Hub token from the device web app.
The band sensor telemetry is send via http to the Azure IoT Hub, using the token it obtained earlier.
The Azure Stream Analytics job processes that telemetry data in real time, and outputs to three different destinations.
The hot path is wired to Power BI, and charts the data in a dashboard in real time.
The cold path writes the data to Azure table storage, for historical analysis and processing.
The interactive path is trigger when the heart rate goes above a certain threshold, and is written to an Azure Service Bus queue.
An Azure WebJob pull data off the service bus and pumps it to the tracker web site, via a REST API call.
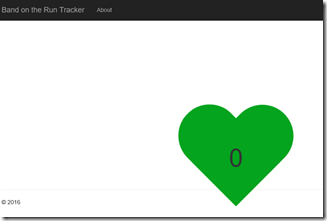
The tracker web site uses SignalR to send the live heart rate data down to bowsers, to be displayed in real time:
The heart goes from green through orange to red, and beats faster, as the hear rate increases.


