Azure Machine Learning – Data Understanding
Continuing on with our introduction of the Azure Machine Learning service, we will step back from the high-level demos used in two previous posts and begin a more pragmatic look at this service. This post will explore the methods available for data ingress and highlight some of the most common and useful task in beginning your machine learning experiment.
The Data Mining Methodology
Before we dig in, let’s add some context and review one of the prevailing process methodologies used in machine learning. The CRISP (Cross Industry Standard Process) for Data Mining defines six major phases for data mining or machine learning projects. These six phases are mostly self-explanation and are as follows:
- Business Understanding
- Data Understanding
- Data Preparation
- Modeling
- Evaluation
- Deployment
Please note that while these steps are listed in a linear fashion, this methodology is designed to be iterative, such that in subsequent iterations we continually refine our experiment through increased understanding. In this post, we are going to focus on step two: Data Understanding within Azure Machine Learning Services.
Collecting Data
With the CRISP methodology, the Data Understanding phase begins with data acquisition or the initial data collection. The Azure Machine Learning service offers us a number of different options to onboard data into data sets for use within our experiments. These options range from uploading data from your local file system as seen in our initial experiments to reading data directly from a Azure SQL database or the web. Let’s dig in and look at all the options that are currently available.
- Dataset from a Local File – Uploads a file directly from your file system into the Azure Machine Learning service. Multiple file types are supported and inclued : Comma Separate Value (*.csv), Tab Separate Value (*.tsv), Text ( *.txt), SVM Light (*.svmlight), Attribute Relation File (*.arff), Zip (*.zip) and R Object/Workspace (*.rdata)
- Dataset from a Reader – The Reader task provides a significant amount of flexibility and allows you to connect to and load data directly from Http (in multiple fomats0, SQL Azure databases, Azure Table Storage, Azure Blob Storage, a Hive Query and from the slightly confusingly named Power Query which is really an OData data.

- Dataset from an Experiment – The result of an experiment (or any step within the experiment) can also be used by simply right-clicking on the task output and selecting the ‘Save as Dataset’ option.
Understanding Data
After data collection comes understanding as we begin to familiarize ourselves with the data and its many facets. This process is our first insight into the data often starts with a profiling exercise that is used to identify not only potential data quality problems but can also lead to the discover of often interesting subsets of so-called hidden information. During this phase of data understanding some of the common activities are:
- Identifying data types (string, integer, dates, boolean)
- Determining the distribution (Discrete/Categorical or Continuous)
- Population of values or identification missing values (dense or sparse)
- Generating a statistical profile of the data (Min, Max, Mean, Counts, Distinct Count, etc)
- Identifying correlation within the data set
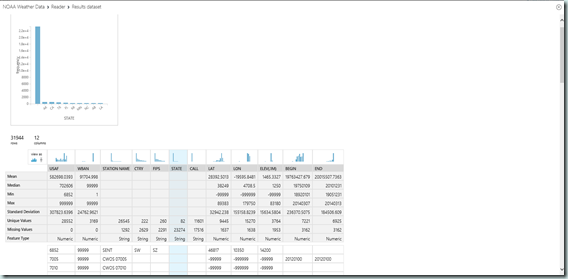
To accomplish facilitate this step, the Azure Machine Learning service provides a number of useful tasks and features. The first and easiest to use is the “Visualize” option found on the context-menu (right-click) of each task output. Using this option provides a basic summarization of the data including a list of columns, basic statistics, a count of unique and missing values and the feature (data) type.
While the Visualize feature is a great tool for initial insight, often to further our understanding we will need a broader and deeper look into the data. For this we have two tasks : Descriptive Statistics and Elementary Statistics both found under the Statistical Functions category.
The Descriptive Statistics task calculates a broad set of statistics including counts, ranges, summaries and percentiles to describe the data set while the Elementary Statistics task independently calculates a single statistical measure for each column which is useful for determining central tendency, dispersion and shape of the data. Both of these task output a tabular report of the results which can be exported and analyzed independent and external to the service.
Finally, we look at the Linear Correlation (Statistical Functions) task. This task calculates a matrix of correlation coefficients which measures the degree of relationship or correlation between all possible pairs of variables or columns within our dataset. Using this correlation coefficient, we can identify how variables change in relation to one another with a coefficient of zero meaning there is no relationship and a value of (+/-) one implying there are perfectly correlated.
Wrap-Up
In this post, we began a more pragmatic look at the Azure Machine Learning service. Focusing in specifically on the Data Understanding phase of the CRISP Data Mining Methodology, we looked at the various options for both data ingress or collection and the tasks available to help use build an understanding of the data we are working with. In the next post, we will move on to the third phase of the methodology: Data Preparation.
Till next time!


