Add Spark to Your OData: Consuming Data Services in Excel 2010 Part 2
Last post I talked about how you can create your own WCF data services (OData) and use PowerPivot to do some powerful analysis inside Excel 2010 as well as how to use the new sparklines feature. If you missed it:
Add Spark to Your OData: Consuming Data Services in Excel 2010 Part 1
In this post I want to show how you can create your own Excel client to consume and analyze data via an OData service exposed by SharePoint 2010. I’ll show you how to write code to call the service, perform a LINQ query, data bind the data to an Excel worksheet and generate charts. I’ll also show you how you can add these cool sparklines in code.
Consuming SharePoint 2010 Data Services
You can build your own document customizations and add-ins for a variety of Microsoft Office products using Visual Studio. You can provide data updating capabilities, integration with external systems or processes, write your own productivity tools, or extend Office applications with anything else that you can imagine with .NET. For more ideas and tutorials, check out the VSTO Developer Center and the VSTO Team blog.
Let’s create a customization to Excel that analyzes some data from SharePoint 2010. SharePoint 2010 exposes its list data and content types via an OData service that you can consume from any client. You can also use the service to edit data in SharePoint as well (as long as you have rights to do so). If you have SharePoint 2010 installed, you can navigate to the data service for the site that contains the data you want to consume. To access the data service of the root site you would navigate to https://<servername>/_vti_bin/ListData.svc.
For this example, I created a sub-site called Contoso that has a custom list called Incidents for tracking the status of insurance claims. Items in the list just have a Title and a Status field. When I navigate my browser to the Contoso data service https://<servername>/Contoso/_vti_bin/ListData.svc, you can see the custom lists and content types get exposed as well.
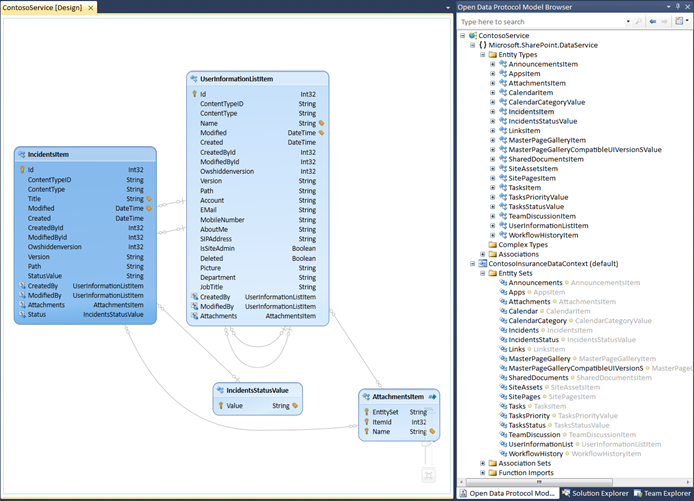
However, there is a better way to explore the types that OData services expose using a Visual Studio 2010 extension called the Open Data Protocol Visualizer. You can install this extension directly from Visual Studio 2010. On the Tools menu select Extension Manager, then select the Online Gallery tab, choose the Tools node and from there you can install the visualizer. Once you restart Visual Studio you can add a service reference to the data service, right-click on it and select View in Diagram. Then you can select the types you want to explore:
Creating a Document Customization for Excel 2010 using Visual Studio 2010
We want to customize Excel with our own .NET code that calls this SharePoint OData service and does some data analysis on the Incident data stored in the Contoso SharePoint site. Starting in Visual Studio 2008 you could select from a variety of Office 2007 project templates, Excel Workbook being one of them. Visual Studio 2010 now adds support for Office 2010 projects as well as 64-bit support.
In Visual Studio 2010 create a new project and select the Office 2010 node and choose Excel 2010 Workbook. This will create a document-level customization for Excel 2010. The difference between selecting an Add-in versus a document customization is that an Add-in will run every time the user opens the application, regardless of the document being opened. Here I want to create a document-level solution so that only this document has the custom code. This also gives us the benefit of using the Excel designer to quickly lay out controls on our worksheet.
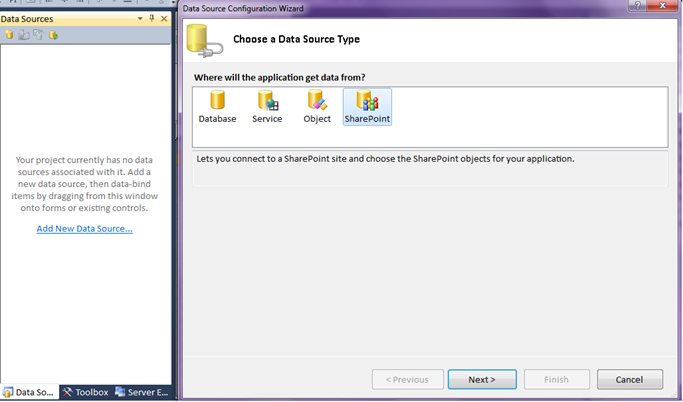
We want to bind to the list of data coming from our Incidents list to an Excel worksheet so first we need to add a reference to the SharePoint 2010 data service. Open the data sources window (from the Data menu select Show Data Sources) and click the link Add New Data Source to start the Data Source Configuration Wizard. New in Visual Studio 2010, you can select a SharePoint data source:
Selecting this and clicking Next will just open up the Add Service Reference dialog which is the same as adding it directly from the Solution Explorer, it’s just more convenient here since we’re going to do some data binding. Here you specify the address of the SharePoint 2010 data service, I named the service reference ContosoService in this example. Click Finish and now you will see the Data Sources window populated with the types exposed by the data service.
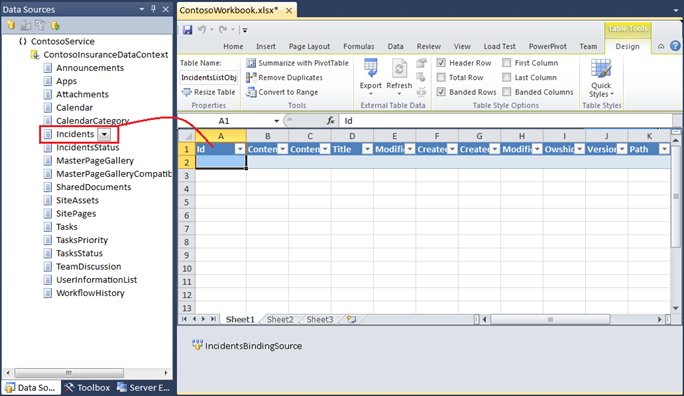
Now it’s time to do some data binding. Simply drag the Incidents list from the Data Sources window onto the design surface for Sheet1. This design surface is actually Excel 2010 being hosted inside Visual Studio. You can access all of the design features of Excel from here just like if you were working in Excel outside of Visual Studio.
This sets up a ListObject control named IncidentsListObject that is bound to a windows forms BindingSource that is created for you in the component tray. When you set the DataSource property of this BindingSource the data is displayed. But before we query the data from the data service, I want to hide some of the columns in the IncidentListObject to only show the Title and StatusValue columns. You do this by selecting the column range, right-click and choose Hide.
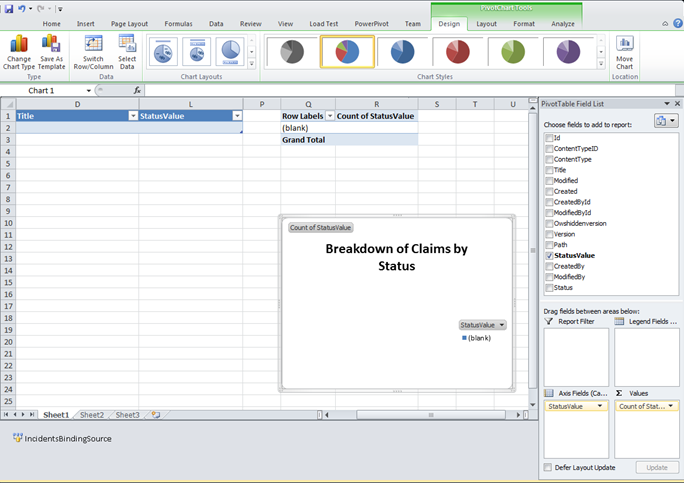
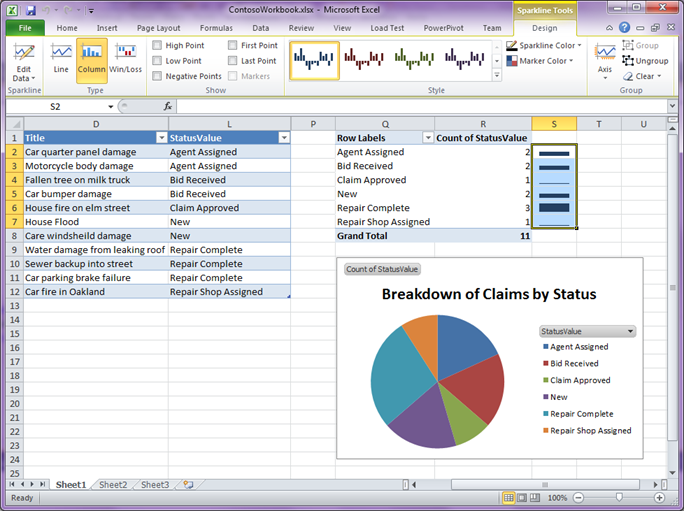
Next we want to add a PivotTable and pie chart to show a breakdown of incident claims by their status. If you are familiar with creating PivotTables and charts in Excel then this part is easy. Select the IncidentListObject on the sheet, then on the Excel Ribbon choose the Insert tab and drop down the PivotTable button on the far left and select PivotChart. The range will be set to the IncidentsListObject so just choose a location; for this example I placed it in the same sheet. In the Pivot Table Field List check the StatusValue field, drag it to the Values section, and then set the chart type to Pie Chart.
Now that we have our data and charts laid out how we want, we can write a LINQ query to get the SharePoint data.
Calling the SharePoint OData Service and Binding Data
When you add a data service reference to your project, a .NET assembly reference is added automatically for you to System.Data.Services.Client. This client assembly is needed in order to write LINQ queries against any data service. We could easily provide a UI to the user to call this service in the form of a custom Task Pane or Ribbon using those designers in Visual Studio, but for this example we’ll keep it simple and just add the code to the sheet directly. So open up the code-behind for Sheet 1 and in the Sheet1_StartUp event handler write the following code:
 'Pull in sharepoint list data via OData service
Dim ctx As New ContosoService.ContosoInsuranceDataContext(
    New Uri("https://<servername>/contoso/_vti_bin/listdata.svc"))
ctx.Credentials = System.Net.CredentialCache.DefaultNetworkCredentials

'Linq query to return incidents data from SharePoint
Dim results = From i In ctx.Incidents Order By i.StatusValue

'Databind the list
Me.IncidentsBindingSource.DataSource = results.ToList()

'Refresh pivot table
Dim pvt As Excel.PivotTable = Me.PivotTables("PivotTable1")
pvt.RefreshTable()
Hit F5 to start the debugger and Excel will display the data from our SharePoint data service and you will see the breakdown of status on the claims in the Incidents list.
Adding Sparklines in the Customization Code
New we want to add those cool sparklines. This time I want to add the column type of sparkline to give a visual queue of how many claims fall into the respective status. Same data as the pie chart in this case but just a different visualization. And since I don’t have a series of data in each row like in the previous example, I need the sparkines to scale across the group. Here’s the code to do that:
 Private Sub AddSparkLines(ByVal pvt As Excel.PivotTable)
    'Get the row where the actual data starts
    Dim row As Integer = pvt.DataBodyRange.Row
    'Get the count of data rows but do not include the pivottable totals
    Dim count As Integer = pvt.DataBodyRange.Rows.Count + row - 2
    'Get the data range in "A1:B2" format
    Dim dataRange = String.Format("{0}{1}:{0}{2}",
                    Me.ConvertToLetter(pvt.RowRange.Column + 2), row, count)
    'Get the location range in "A1:B2" format
    Dim locRange = String.Format("{0}{1}:{0}{2}",
                    Me.ConvertToLetter(pvt.RowRange.Column + 1), row, count)

    'Create the sparklines
    Dim range = Me.Range(dataRange)
    range.Select()
    range.SparklineGroups.Add(Excel.XlSparkType.xlSparkColumn, locRange)

    'Set properties on the min and max scale to show across the group
    Dim sp = range.SparklineGroups.Item(1)
    sp.Axes.Horizontal.Axis.Visible = True
    sp.Axes.Vertical.MaxScaleType = Excel.XlSparkScale.xlSparkScaleGroup
    sp.Axes.Vertical.MinScaleType = Excel.XlSparkScale.xlSparkScaleGroup
End Sub
'Converts column numbers to Excel column letters
Function ConvertToLetter(ByVal col As Integer) As String
    Dim result As String = ""
    Dim alpha = Int(col / 27)
    Dim remainder = col - (alpha * 26)
    If alpha > 0 Then
        result = Chr(alpha + 64)
    End If
    If remainder > 0 Then
        result = result & Chr(remainder + 64)
    End If
    Return result
End Function
Add a call to the AddSparkLines method after the call to RefreshTable and now when we hit F5 again we’ll see the column style sparklines next to the PivotTable.
As you can see there are a lot of the possibilities of what you can do with the Open Data Protocol and the types of analysis you can do with OData feeds in Excel 2010. You can easily build WCF data services in Visual Studio to expose your own OData feeds. You can use PowerPivot, a powerful Excel Add-in, to analyze data from a variety sources, including OData services, or you can use Visual Studio build your own Excel clients to consume and analyze OData sources from your Line-of-Business systems like SQL Server and SharePoint.
Enjoy!
Comments
Anonymous
April 21, 2010
Beth, any chance that you'll write up an example combining odata and ms access for crud operations?Anonymous
April 21, 2010
I mean, odata and access, without sharepoint.Anonymous
April 22, 2010
Awesome posts on OData Beth! Very and well appreciated, really needed these two posts. You're on fire with all your recent posts in the past several days! # call outs in the four call out content section on the MSDN home page? I don't think even Scott or the sage of Sources of Insight has done that recently! Holy cow! ;>) Thanks for all you do for the community, and for the consistently superior quality, relevance and brilliance your contributions roundly demonstrate on such an incredibly consistent basis. All the best, Adam Adam Cassel Senior DBA Children's Hospital BostonAnonymous
April 23, 2010
Hi ultrapang, I would not recommend hosting an Access database behind a service because of scalability issues you have with file-based databases like Access. Instead I would recommend looking at SQL Server (or even the free SQL Express). If you really need to stay with Access then I would look into the new Access 2010 feature of being able to host the data in SharePoint. I haven't played with it myself but it might be a way to get the scalabilty and discoverability you need. Cheers, -BAnonymous
April 23, 2010
Hi Adam, Thanks for reading and the kind words. Comments like this are the reason why I get up in the morning and go to work. :-) Cheers, -BAnonymous
April 26, 2010
That's not what I was after; I wouldn't use an access db behind a service either. I was asking about Access as client, tapping into a service 'over there' via odata. Sorry for the lack of clarity.Anonymous
February 17, 2011
The comment has been removedAnonymous
March 24, 2011
Hello Beth , Can we build ad hoc kinda reports using powerpivot ? Please advise. Thanks, SenAnonymous
April 20, 2011
Nice work, I have implemented some end user reports based on this. Is it possible to change the column order, or to delete the unwanted columns entirely? I can't figure out how to do it. I've resorted to returning a type from the service that has only the columns I need, and defined in the exact order I required.Anonymous
April 21, 2011
@Ross -- yes you can just drop an empty list object on the design surface and then bind it in code. There you can sepcify the data binding & order manually.Anonymous
September 22, 2011
Thanks for the listobject tip, i was just asked to change one the spreadsheets i created and thought i would investigate (i had previously just ordered the columns in my data to match the requirements. It was easy to get working : msdn.microsoft.com/.../ms178775.aspx However, I can't figure out how to change the column headers when manually binding in code, eg i have a ProductName property in my data, but wan't the column to read Product. I am going to try crudely updating the cells after i have done the SetDataBinding.Anonymous
September 22, 2011
In case anyone is interested. to name the columns i had to :
- Don't set the ListObject AutoSetDataBoundColumnHeaders = true; You can't rename the cols then. 2.list1.SetDataBinding(this.AccountManagersBindingSource, "","CustomerName", "LocationName", "ProductName","PricingDepotName","Premium");
- this.Cells[6, "A"] = "Customer"; this.Cells[6, "B"] = "Location"; this.Cells[6, "C"] = "Product"; this.Cells[6, "D"] = "Pricing Depot"; this.Cells[6, "E"] = "Locn Premium";
