Computer Vision for Augmented Reality
This blog post is a condensed version of one of my recent talks on Augmented Reality and computer vision. Since my colleagues Matteo Pagani and Sebastien Bovo released the practical approach to WinML in Windows 10 and Hololens Unity, I felt it's time to shed some light on the theory.
1. The Why
Thanks to the runaway success of mobile AR games, such as Pokemon GO, the experience of augmented reality has become familiar to the mainstream audience. This gets even more important, as big companies such as Microsoft, Apple and Google made AR APIs part of their operating system, they're now available for everyone. In the beginning, those APIs were rather lean, only allowing to place holograms somewhere in that area but lateley SLAM capabilities (Simulataneous Localization and Mapping, algorithm-based position prediction based on sensory input) were have been added. That allows a more accurate placement of holograms in the environment, e.g. on top of shelves or beneath tables.
With computer vision, I think we will see a next step in AR, allowing even more realism and immersion in many fields in the consumer and enterprise space.
2. The Basics
Note: Please keep in mind that I'm conveniently skipping over the math part, as I'm just trying to give a basic understanding of how computer vision works.
2.1 The big picture
What is Machine Learning? Well, for a start it's one of those buzzwords StartUps keep using to get funded. If you talk to a computer scientist or data scientist however, they will tell you it's generally the idea of computers finding interesting things in sets of data with the help of generic algorithms without them (the scientist) having to write code specific to the problem. Instead, they only feed data to the generic algorithm and it builds it own logic based on the input.
For example, take the classification algorithm: it sorts data into different groups. The same generic algorithm that is used to differentiate cats from dogs can be used to recognize handwritten letters. It's the same algorithm, but it's fed different training data so it builds a different classification logic.
Pretty neat, huh?
2.2 Supervised Learning
There are basically two main umbrella categories for machine learning. one is supervised learning, the other is, unsurprisingly, unsupervised learning.
So, what is supervised learning and why is the difference important?
Say you have a small retail business on eBay (or Amazon Markets) selling all sorts of cables. LAN, Lightning, USB, you name it! You're doing great and would like to go on extended vacation with your family and hand over the business to a trainee in the meantime. In order to help your trainee you have written down some previous sales in Excel, showing the price of a cable based on the port, color and length.
| Length | Port | Color | Price |
|---|---|---|---|
| 1.0m | USB-C | Black | 9.99€ |
| 0.5m | Lightning | White | 29.99€ |
| 2.0m | microUSB | Red | 12.99€ |
| 2.0m | USB-C | Red | 13.99€ |
| 0.5m | microUSB | White | 6.99€ |
Using the information from previous sales, you want your trainee to figure out the price for any other cable that is ordered.
| Length | Port | Color | Price |
|---|---|---|---|
| 2.0m | Lightning | White | ?.??€ |
S/He already knows how other cables were previously sold for and with some skills in arithmetics s/he could figure out the price of the 2.0m Lightning cable. And if s/he's smart, s/he would come up with weighting the input parameters to fine-tune the predictability of your algorithm.
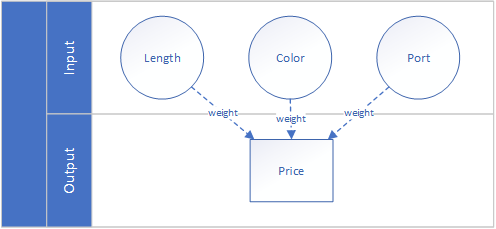
That is called supervised learing, as you letting your trainee (or your computer) figure out the relationship (and importance) between length, port, color and price.
Okay, letting my trainee do all the work while I'm on vacations sounds good to me! Why do I need unsupervised learning then?
Short answer: for computer vision, you won't! But if you're interested in patterns that could help you with marketing and sales, this is for you. For example you would find out that Lightning cables are usually sold in white and never in a size above 2.00m. Or that USB-C is sold equally in any color, except for the length below 1.00m, then it's alway black. And so on.
There are also other categories of machine learning (e.g. reinforcement learning), as well as hybrids (semi-supervised and active). For more information see here: https://en.wikipedia.org/wiki/Machine_learning#Machine_learning_tasks
2.3 Neural Networks
Our trainee might have figured out that the algorithm only works for linear relationships between input and output. But what if the right pricing prediction only comes to light when combining parameter results into intermediate layers, e.g. color combined with a certain port has a completly different weight?
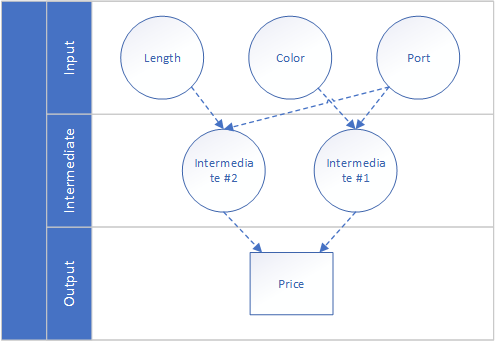
This small unit of input data creating an output is called a neuron. It doesn't do much, but imagine the power of combining tens or hundreds of these neurons into a big network. That is called a neuronal network. Or a brain, on a much bigger scale.
Easy, huh? Well not so fast! I did not talk about data preprocessing (e.g. mean normalization, standardization or min-max normalization) or activation. It's very important to preprocess and standardize the inputs for the generic algorithm, so each input contributes approximately proportionally to the output. And sometimes the neuro should only be activated once a certain treshold in the input is reached, comparable to the action potential firing a neuron in your brain. This is called the activation function of a node.
What I also did not cover yet is the state of a neural network. If we will run our stateless neuronal network on our business numbers, it will predict "predictable" but it will never be able to adapt to seasonal buying patterns or learn from its mistakes. The network needs a memory to improve the prediction and the memory updating the network everytime it is used. This very simple (and very hard) idea is called Recurrent Neuronal Network and is widely used in text generation, machine translation and speech recognition.
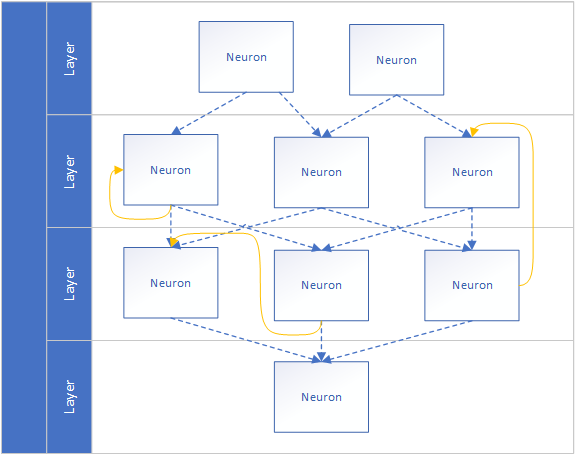
Further information can be found here: https://www.wildml.com/2015/09/recurrent-neural-networks-tutorial-part-1-introduction-to-rnns/
2.4 Convolutional Neural Networks
So, we were talking about business numbers and predictions a lot, but the title clearly says computer vision. The connection isn't clearly visible yet (excuse the pun)!
Computer vision (as well as speech recognition) has kept the computer scientist puzzled for a long time and made some break-throughs only recently with so-called convolutional neural networks. We already covered the neural network part, but what is convolutional?
To explain this, we need to take a step back and look at our favorite cat picture (or dog picture, if you're a dog person). How could a binary input possibly fed into a neural network? Well in computer science everything is just a clever reprentation of numbers. Not the 1s and 0s, because that's a step too far but every colored pixel in the image is just a 3-dimensional (RGB, or 4-dimensional if you're talking CMYK) array of numbers. So a pixel of a firetruck is likely represented as [255,0,0] while a pixel of sun could be a [100,255,0] or a pixel of a leaf [0,255,100]. You get the point. By separating the color dimensions (and thus flattening them to grey-scale) and cutting the original image into smaller chunks (e.g. 32x32), we now have an array of 1024 values for each chunk. This is the input that is fed into our neuron.
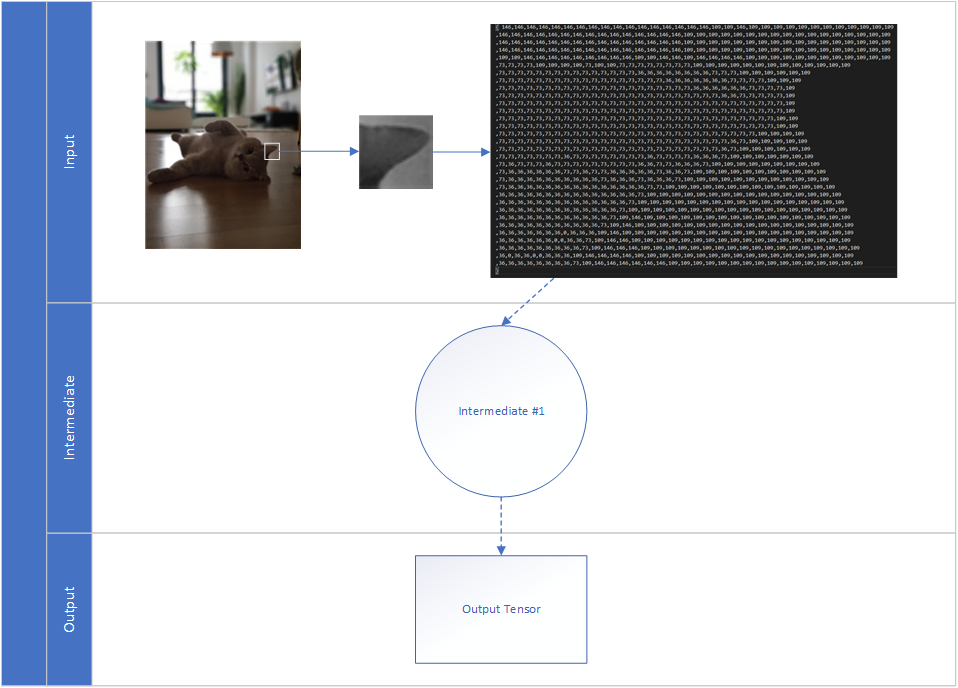
Of course, a single tile doesn't make a cat. What we need is more data! We get that data by analyzing all the pieces of the cat picture in many intermediate layers that feed their output in the next intermediate layer. This more complex neuronal network is called deep neuronal network, its training is called deep learning.
There is one catch, though. Using this neural network might allow me to recognize my cat laying on her back in the living room, but it won't be able to recognize any other cat or my cat in a different pose or different room. Does it mean we have to re-train the model for every cat in the world in every possible position? Eeek!
This is where Convolution comes to the rescue. The idea of convolution has its origin in biology and how mammal brains process image information. Some genius mathmaticians and computer scientist thought it's nice to convert that process into an algorithm. How right they were!
As a first step, the image is cut into overlapping chunks (e.g. of a size of 32x32) and its position in the original picture is stored. Each tile is then fed as input into the same neural network. Yes, the same neural network is used for every initial tile, therefore every chunk is evaluated equally! If the tile contains anything particulary interesting, it is marked as interesting. The output for each tile is placed according to the original position of the tile, so the overall result is a matrix of output arrays. This matrix contains information of where the most interesting parts of the picture were found. (Note: interesting is relative, and intrinsic to that layer - e.g. gradient changes, zig-zag patterns or even large patterns of blue). The matrix is rather large, however. Compression isn't an option as we actually need to achieve non-linear information loss. So downsampling it is, max pooling in particular. In layman terms, the algorithm just looks at each 2x2 square and just keeps the biggest (a.k.a. most interesting) number.
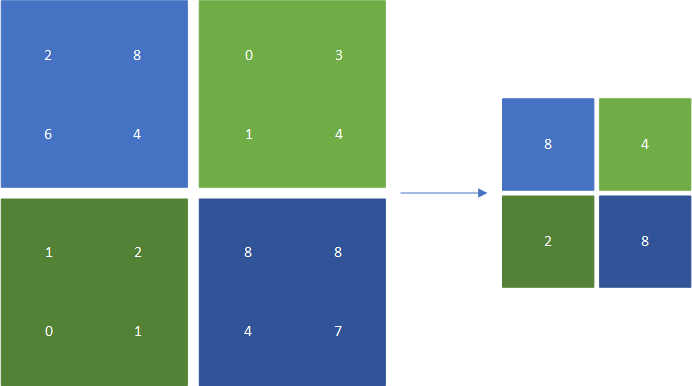
And that's it! In a very, very simple world the reduced output array is now fed into a fully connected neural network that decides whether it's a cat or not. In real world, many convolutional and pooling layers stack on top of each other. To get a feeling you can peek into mature models, such as SqueezeNet, with the amazing Netron model visualizer by Lutz Röder (https://github.com/lutzroeder/Netron)

2.5 Testing the prediction
If you run your model on a service such as our Custom Vision service (https://customvision.ai) you may have seen some accuracy indicators. But what do they mean? If you feed your network with 10000 cat pictures and it predicted the correct answer in 97.8% of the time that sounds rather good. But does it really? Say I write a tiny method
 private bool IsCat(byte[] image)
{
    return true;
}
and feed it 9850 cat pictures and 150 dog pictures, my dumb method is more accurate than our trained Convoluted Neural Network! I guess that settles it: Programmers > Data Scientist. Yay!
Actually, no! In our custom vision service, a generic accuracy isn't displayed for a reason. Instead Precision and Recall are displayed
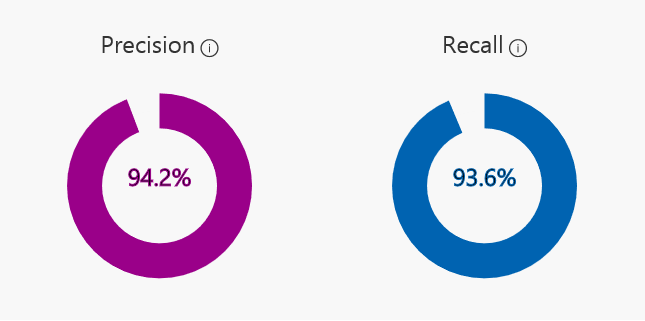
To understand both, we need to define right and wrong in its 4 states:
- True positive: a cat picture is correctly identified as cat
- False positive: a dog picture is mistakenly labeled as cat
- True negative: a dog picture is correctly identified as not-a-cat
- False negative: a cat picture is mistakenly identified as not-a-cat
The results can be displayed in a 2x2 matrix.
| cat | not-a-cat | |
|---|---|---|
| cat picture | 9525 | 325 |
| dog picture | 27 | 123 |
Particulary interesting are the true positives and true negatives obviously, but also the mistakes. The weighting of the mistakes however depends on your particular case. Say you have a computer vision enabled cat feeding bowl, your cat might be more interested in the false negatives while your dog might be more interested in the false positives.
Precision is True positives / positive guesses. In layman terms if a cat is predicted by the model, how likely is that to be right?
Recall True positives / total amount in dataset. Or, much easier: What percentage of the actual cat pictures did the model correctly find?
So, in 94.2% the model guessed cats it was right. But it also found 93.6% of the cats in the data set.
3 The Implementation
The actual implementation is the easier part. It all should start with the evaluation of the use-case: is the device likely to be connected to the Internet? If so, do you require a continuous prediction or is an on-demand evaluation sufficient? On-Demand predictions on an always-connected device (e.g. a mobile device) are usually the easiest to implement, it's just a matter of REST calls and JSON deserialization. It's also nicer to the battery of the AR device.
 public IEnumerator AnalyseCapturedImage(byte[] imageBytes)
{
    using (var unityWebRequest = UnityWebRequest.Post(endpoint, new WWWForm()))
    {
        unityWebRequest.SetRequestHeader("Content-Type", contentType);
        unityWebRequest.SetRequestHeader(headerKey, predictionKey);
        unityWebRequest.downloadHandler = new DownloadHandlerBuffer();
        unityWebRequest.uploadHandler = new UploadHandlerRaw(imageBytes) { contentType = contentType };
        yield return unityWebRequest.SendWebRequest();

        try
        {
            var jsonResponse = unityWebRequest.downloadHandler.text;
            var analysedObject = JsonUtility.FromJson<AnalysedObject>(jsonResponse);

            //you can now find the prediction result in analysedObject.predictions
        }
        catch (Exception e)
        {
            // exception handling
        }
    }
}
If you're not connected to a reliable internet uplink or want to have continuous predictions, you should opt for a local evaluation. This is much heavier on the CPU or GPU, depending on the capabilities of your device and framework.
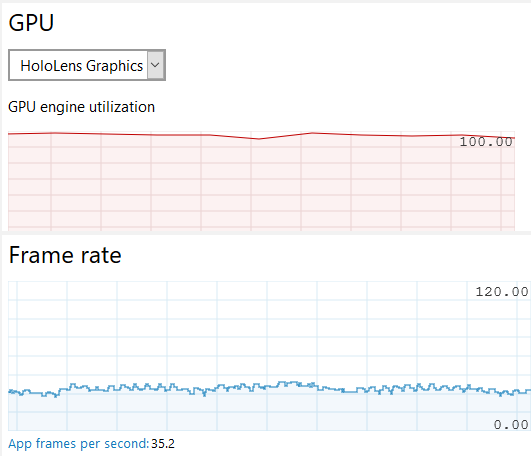
A Hololens running RS4 (1803) is not able to use the GPU, all predictions will be executed on the CPU. This will drain the battery really fast. If your device is upgraded to RS5 (1805) you are able to utilize the GPU. Just load the model from the local storage and bind the output. There is one catch though: if you're using the CustomVision service to train and export your model (like I do) you have to export it as v1.2 otherwise MLGen will give you a completly random error message.
My colleague Sebastian described the Windows ML implementation in great detail in his blog post