Configuring the EXDI Debugger Transport
This topic describes how to set up Kernel-Mode Debugging using EXDI. The Extended Debugging Interface (EXDI) is an adaptation layer between a software debugger and a debugging target.
The Debugging Tools for Windows supports kernel debugging using EXDI starting with Windows version 22000.
The user interface to configure EXDI is available in the debugger starting with version 1.2410.11001.0.
EXDI can be used to establish a connection with the QEMU virtual environment. For more information, see Setting Up QEMU Kernel-Mode Debugging Using EXDI.
Note
EXDI is an advanced, specialized form of debugging for specific environments. Using a standard KDNET connection is easier to configure, and is recommended. To set up network debugging automatically, see Setting Up KDNET Network Kernel Debugging Automatically.
EXDI COM server overview
EXDI is an interface that extends WinDbg by adding support for hardware debuggers (e.g. JTAG-based, or GdbServer based). The diagram below illustrates the role of EXDI-GdbServer.
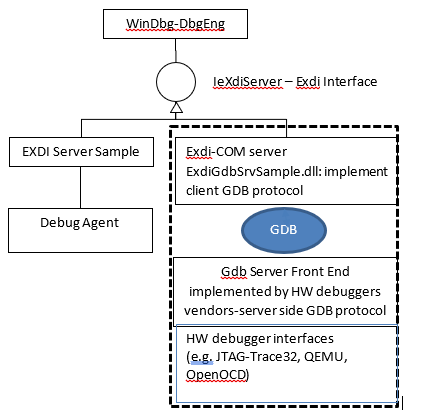
A COM server refers to a binary component implementing a COM interface. In this case exdi3.idl implemented by ExdiGdbSrv.dll for the Windows debugger protocol client.
The ExdiGdbsrv.dll itself implements the client side of the GDB-RSP protocol the GDB server side (or sometime called GDB server stub) is implemented by the QEMU GDB Server (or Trace32/OpenOCD/UEFI GDB server stub, etc.)
As the EXDI connection has no dependency on Windows or the Windows debugging KDNET protocol being loaded on the target PC. Because these software debugger components are not required, EXDI can be useful in early device bring up and in debugging OS startup issues.
Important
Because EXDI does not make use of the KDNET protocol, the connected debugger has significantly less information about what is running on the PC and many commands will work differently or may not work at all. Access to private symbols for the code being debugged can help the debugger better understand the target systems code execution. For more information, see Public and Private Symbols.
EXDI Kernel-Mode device requirements
The computer that runs the debugger is called the host computer, and the computer being debugged is called the target computer.
The following is required:
On the target and host computer, a supported network card supported by the desired environment such as QEMU.
A network connection between the target and host using TCP/IP.
Windows 10 or Windows 11 version 22000 or later.
Limitations
As described above, because EXDI does not make use of the KDNET protocol, the connected debugger has less information about the target system and the use of the debugger is different. Without access to private symbols for the target code, many commands that use symbols to understand the state of the target system will not work. In this case, it is possible to view memory and register contents and disassemble code. Determining the location of running code, or performing other common debugger tasks, can be very difficult and time consuming without private symbols.
Concurrent EXDI and KDNET debugging
In some complex scenarios, for example in early device bring up, it can be useful to have two connections to the target device. One EXDI and one KDNET. If the target is a Windows OS, KDNET software debugging is configured as it would normally be, for example to connect to a virtual machine. In this setup, either of the two concurrent debuggers can break in to debug code on the target machine.
WinDbg in process server
The binary EXDI component can run either out of the Windbg process or within the Windbg process. Using the EXDI UI or the Inproc=<EXDI COM server binary> substantially improves reliability, by reducing COM start up errors. Therefore, it’s always recommended to run the EXDI session with the Inproc parameter, which is always enabled when using the UI.
For command line startup the default option is out of process, but inprocess should be enabled using the InProc=ExdiGdbDrv.dll parameter.
COM GDB Server client
This topic describes the use of the EXDI COM GDB Server client (ExdiGdbSrv.dll), that implements the EXDI COM debugger interface. It is possible to use the same COM interface to implement other interfaces, such as an EXDI COM Server for JTAG-DCI.
Summary of process to use an EXDI connection
Use this this process to use an EXDI connection with WinDbg.
- Download and install the Windows debugging tools on the host system.
- Launch WinDbg using the UI or the -kx option to connect to the EXDI server.
- Use WinDbg to debug the target system using a sub set of available debugger commands.
For an example EXDI usage scenario, see Setting Up QEMU Kernel-Mode Debugging Using EXDI.
Download and install the Windows debugging tools
Install the Windows Debugging Tools on the host system. For information on downloading and installing the debugger tools, see Debugging Tools for Windows.
Launch WinDbg and connect to the EXDI server
The following options can be configured in the EXDI kernel connection UI.
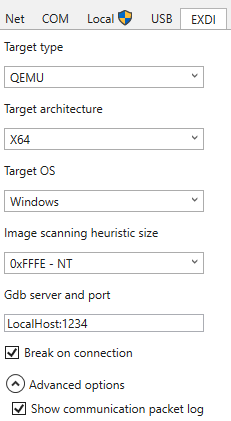
Target type
[Trace32|BMC-OpenOCD|QEMU|VMware|UEFI]Select according to the target type you would like to debug. The following target types are available.- Trace32 : Lauterbach Trace32 HW debugger GDB server configuration
- BMC-OpenOCD : BMC-OpenOCD HW debugger GDB server configuration
- QEMU : QEMU SW simulator GDB server configuration
- VMware : VMware GDB server configuration
- UEFI : UEFI firmware debugging
Target architecture
[x86 | ARM64 | x64]- Target processor architecture. Note that all target types may not support all target architectures.Target OS
[Windows|Linux]- Select according to the target OS you would like to debug.Image scanning heuristic size
[None | 0xFE - PreNT |0xFFE - NT]- Select one of the three options to determine heuristic size for image scanning. This value configures how the debugger engine scans memory looking for the PE DOS signature, that is used to gather code execuition state. If the attribute value is not specified (or “0”), then the debugger engine won’t use the fast heuristic and fall back to the legacy heuristic that scan the entire memory looking for the PE DOS signature. The default value is selected for each target type and is recommended.Gdb server and port
TargetIPAddress:TargetPortAddress- Set to the a string that contains, the IPTargetAddress, a colon and the Target PortAddress. For example:LocalHost:1234or168.82.1.5:5555.Break on connections
[on|off]Select check box to break into target after the connection is established.Advanced options
Show communication packet log
[on|off]- Select check box to display in hex values the raw GDBServer communications packet log for debugging and troubleshooting.
After the desired options are selected, select Ok to connect.
Configure advanced options using the EXDI configuration XML files
Most needed options are available in the user interface described in this topic. For information on configuring advanced options using the EXDI configuration XML files, see EXDI XML Configuration files.
WinDbg command line EXDI example
To launch the windbg session that uses the EXDI interface at the command prompt, use these options.
c:\Debuggers> windbg.exe -v -kx exdi:CLSID={29f9906e-9dbe-4d4b-b0fb-6acf7fb6d014},Kd=Guess,InProc=ExdiGdbDrv.dll,DataBreaks=Exdi
To display additional output useful for diagnostic purposes, the -v: verbose session can be used. For general information about the WinDbg options, see WinDbg Command-Line Options. See EXDI WinDbg Load Parameters below for more information.
The debugger console will display the EXDI transport initialization.
EXDI: DbgCoInitialize returned 0x00000001
EXDI: CoCreateInstance() returned 0x00000000
EXDI: QueryInterface(IExdiServer3) returned 0x00000000
EXDI: Server::GetTargetInfo() returned 0x00000000
EXDI: Server::SetKeepaliveInterface() returned 0x00000000
EXDI: Server::GetNbCodeBpAvail() returned 0x00000000
EXDI: ExdiNotifyRunChange::Initialize() returned 0x00000000
EXDI: LiveKernelTargetInfo::Initialize() returned 0x00000000
EXDI: Target initialization succeeded
Kernel Debugger connection established
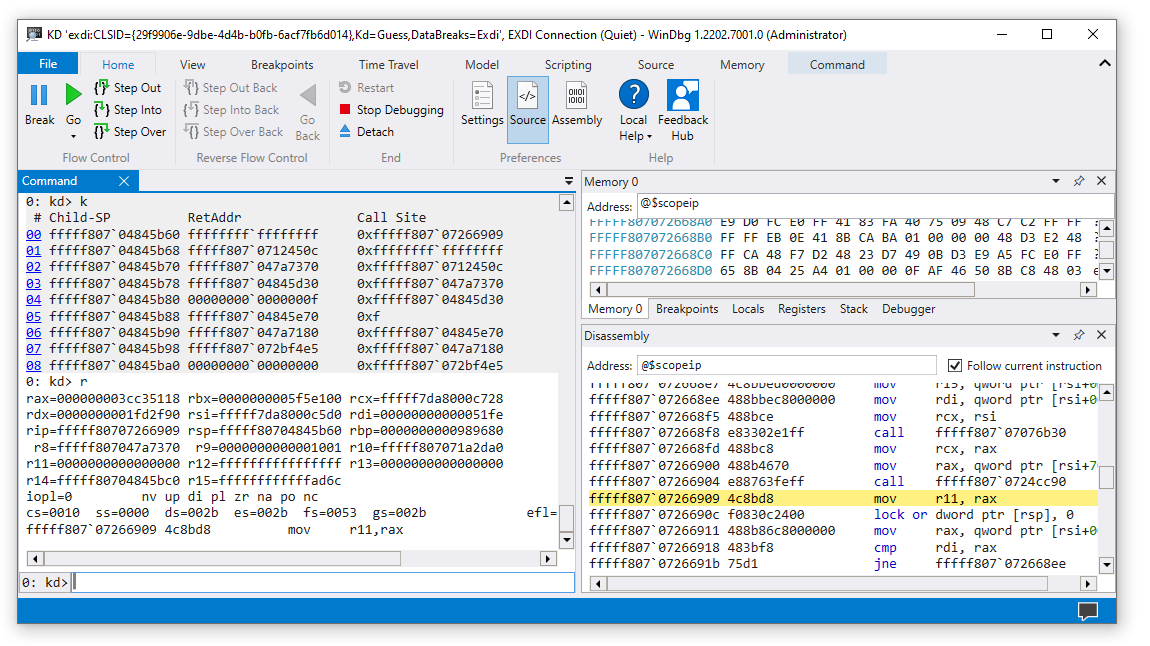
The EXDIGdbServer console window can also display information about the status of the EXDI connection. For more information about the console, see Troubleshooting.
EXDI WinDbg Load Parameters
The following parameters are used with WinDbg to start a EXDI kernel session.
-kx EXDI:Options
The following EXDI options are available with the -kx option. Each option should be separated using a comma.
| Parameter | Description |
|---|---|
| CLSID | Class ID assigned to the LiveExdiGdbSrvServer (as defined in theExdiGdbSrv.idl file). |
| Kd=Guess -or- NtBaseAddr | The debugger engine will use a general heuristic mechanism -or- look for the NT base address. |
| ForceX86 | Forces the debugger engine to use the IeXdiX86Context3 interface for getting/setting The CPU context. |
| DataBreaks=Exdi | Allow using data breakpoints. |
| Inproc | Allow using an inproc Exdi-Server. This option is recommended - InProc=ExdiGdbDrv.dll |
| PathToSrvCfgFiles | The path to the XML configuration files for EXDI. |
Controlling the heuristic search and heuristic size
As described earlier, the debugger uses a heuristic algorithm to locate the NT base address. To cancel the heuristic search, when starting WinDbg via the command line, complete the following steps.
- Set the heuristicScanSize to 0 in the exdiconfigdata.xml file for the target server you will be attaching to.
- Use the
kd=NtBaseAddrheuristic type on the Windbg command line.
For more information on working with XML configuration files, see EXDI XML Configuration files.
Use WinDbg to debug the target system - breakpoints
The dbgeng.dll uses a heuristic algorithm to find the location of the NT base load address at the time that the break command occurred. If private symbols are not available, this process will fail.
This means that under many connection sequences, the break will not function as expected. if you manually break into the code, it will be a random location that Windows happened to be executing at that moment. As symbols for the target code may not be available, it can be difficult to set breakpoints using symbols.
Debugger commands
Commands such as the following that access memory directly will work.
k, kb, kc, kd, kp, kP, kv (Display Stack Backtrace)
d, da, db, dc, dd, dD, df, dp, dq, du, dw (Display Memory)
And you can step through code using p (Step).
There are also commands that can be used to attempt to locate code that you wish to debug.
Imgscan can be helpful with EDXI debugging, as unlike traditional KDNET based kernel debugging, setting breakpoints based on symbols may not be available. Locating a desired target image, can facilitate using its location to set a memory access breakpoint.
.exdicmd (EXDI Command)
The .exdicmd sends an EXDI command to the target system using the active EXDI debugging connection. For more information, see .exdicmd (EXDI Command).
Troubleshooting
Use the output from the ExdiGdbServer window to monitor the connection sequence.
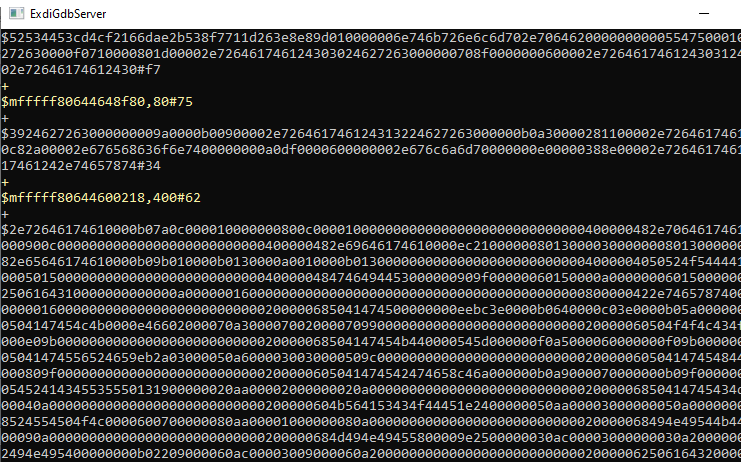
Issue: Error: Unable to establish a connection with the GbDServer. Verify the connection string <hostname/ip>:portnumber
This issue could be caused by:
- The ExdiGdbSrv.dll cannot connect to the target GDB server.
- The GDB server is not running yet at the target.
- Firewall issues, ensure that both IP addresses are reachable by using ping, tracert, or some other tool to verify that the GDB traffic can go through the firewall.
Issue: Error scenario with the target system is not available - DbgCoInitialize returned 0x00000001
The following output may be returned if the target system is not loaded or otherwise not available.
Microsoft (R) Windows Debugger Version 10.0.20317.1 AMD64
Copyright (c) Microsoft Corporation. All rights reserved.

EXDI: DbgCoInitialize returned 0x00000001
This is a common error when the ExdiGdbSrv.dll COM server could not connect to the QEMU GDServer, so it could fail due to:
The previous session of the ExdiGdbSrv.dll is still hosted by a dllhost.exe process, so you’ll need to kill the dllhost.exe process. Use
TaskListat a command prompt to locate the PID of dllhost.exe that hosts the ExdiGdbSrv.dll. UseTaskKill /PID <PID ID> /fand kill the associated PID. For more information about working with PIDs, see Finding the Process ID.The QEMU gdbserver has not been launched yet, or the exdiconfigdata.xml file contains an invalid IP:Port values. If the WinDbg session is launched in the same Host pc as the QEMU Windows VM, then the IP=LocalHost.
Failure at launching the EXDI COM server (ExdiGDbSrv.dll) via the dllhost.exe process (COM related). To resolve this, restart the Host debugger PC or Sign-out Windows and Sign-in again. If that doesn't work, re-register the EXDI COM server after restarting/signing-in again.
regsvr32.exe <full path to the ExdiGdbSrv.dll)
Issue: The debugging session could not be started: FAILURE HR=0x80004005:Failed to AttachKernel.
This issue could be caused by:
- As described above, it is possible that the previous session of the ExdiGdbSrv.dll is still active. Locate and terminate the associated DLL host as described above.
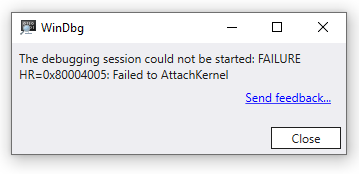
Issue: Could not start kernel debugging using EXDI.
This issue could be caused by:
- There is another instance of the ExdiGdbSrv.dll (hosted by dllhost.exe) running on the host debugger machine.
- Terminate the extra instance of the COM service hosting the ExdiGdbSrv.dll.
- First list the processes, using utility such as TList on the host PC. The DLLHost that is hosting the ExdiGdbSrv.dll will show ExdiGdbServer.
tlist 261928 dllhost.exe ExdiGdbServer
- Use
kill -f XXXXXat the debugger command prompt to terminate the process using the process number.
- First list the processes, using utility such as TList on the host PC. The DLLHost that is hosting the ExdiGdbSrv.dll will show ExdiGdbServer.
Issue: Error: Unable to configure the GdbServer session.
This issue could be caused by:
- An error occurred in locating the session information, such as the path to the XML configuration files.
Issue: Error: The EXDI_GDBSRV_XML_CONFIG_FILE environment variable is not defined.
This issue could be caused by:
- ExdiGdbSrv.dll environment variables are not set or otherwise not available in the environment.
Issue: Error: the EXDI_GDBSRV_XML_CONFIG_FILE environment variable is not defined. The Exdi-GdbServer sample won't continue at this point. Set the full path to the Exdi XML configuration file.
This issue could be caused by:
- The EXDI_GDBSRV_XML_CONFIG_FILE environment variable is not set. In some situations, ExdiGDbSrv.dll would continue working if you press the “OK” button, but windbg.exe will fail querying system registers (e.g. via rdmsr/wrmsr functions).
See also
Setting Up QEMU Kernel-Mode Debugging Using EXDI
Setting Up KDNET Network Kernel Debugging Automatically