Using the Operations Manager Operations console
In System Center Operations Manager, the Monitoring workspace is the primary workspace for operators, network and system engineers, and service desk. The Monitoring workspace is basically the same in both the Operations and Web consoles.
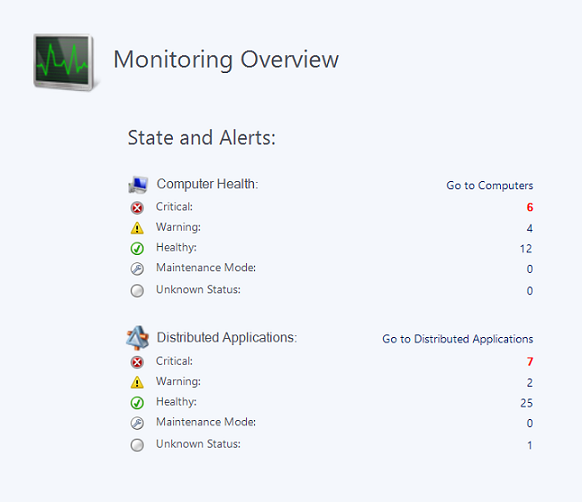
When you open the Monitoring workspace, you see an overview that summarizes the health of distributed applications and computers, as well as the objects that are in maintenance mode, as shown in the following image.

In the State and Alerts overview, select any of the numbers to see a detailed view. For example, if you select the number shown for Maintenance Mode, a state view of all computers in maintenance mode opens.
The health states that are summarized in the overview only tell you part of what is going on in your environment. You'll also want to review the alerts that have been generated. In the navigation pane, select Active Alerts to see all alerts. For more information about dealing with alerts, see Managing Alerts.
There are many views and dashboards in the Monitoring workspace that allow you to view the status of your environment. For information on each view, see Standard Views in Operations Manager. Dashboards allow you to consolidate and visualize operational data from different perspectives to make meaningful decisions. For more information, see Dashboards in Operations Manager. You can also change the display options of a view and save it as a personalized view. For more information, see How to Personalize a View in Operations Manager.
As you work with Operations Manager, you may discover that there are specific views that you frequently access. You can create a customized workspace that displays your favorite views and searches. For more information, see Using My Workspace in Operations Manager.
Next steps
To filter your view of monitoring data so that you can find the exact monitoring object or group of objects that you need, see Finding Data and Objects in the Operations Manager Consoles.
To learn how to use Health Explorer to understand the state of monitored objects in your environment, review Using Health Explorer to Investigate Problems.