Attach a debugger from the task pane
In some environments, a debugger can be attached on an Office Add-in that is already running. This can be useful when you want to debug an add-in that is already in staging or production. If you are still developing and testing the add-in, see Overview of debugging Office Add-ins.
The technique described in this article can be used only when the following conditions are met.
- The add-in is running in Office on Windows.
- The computer is using a combination of Windows and Office versions that use the Edge (Chromium-based) webview control, WebView2. To determine which webview you're using, see Browsers and webview controls used by Office Add-ins.
Tip
In recent versions of Office, one way to identify the webview control that Office is using is through the personality menu on any add-in where it's available. (The personality menu isn't supported in Outlook.) Open the menu and select Security Info. In the Security Info dialog on Windows, the Runtime reports Microsoft Edge, Microsoft Edge Legacy, or Internet Explorer. The runtime isn't included on the dialog in older versions of Office.
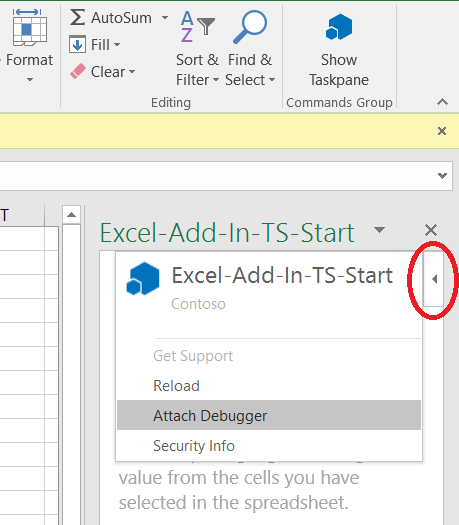
To launch the debugger, choose the top right corner of the task pane to activate the Personality menu (as shown in the red circle in the following image).

Select Attach Debugger. This launches the Microsoft Edge (Chromium-based) developer tools. Use the tools as described in Debug add-ins using developer tools in Microsoft Edge (Chromium-based).
See also
Office Add-ins