Pin Power BI content
Microsoft Dynamics 365 Finance uses Power BI for data exploration. This article explains how you can pin full-page Power BI reports to workspaces to give your users an interactive data exploration experience.
This article assumes that you're familiar with the feature that lets you pin Microsoft Power BI tiles to a workspace. For more information, see Features and services available through Power BI integration. If you're a developer who is creating a workspace, to let users pin Power BI tiles to the workspace, embed the Power BI tile control.
Pin Power BI reports to workspaces
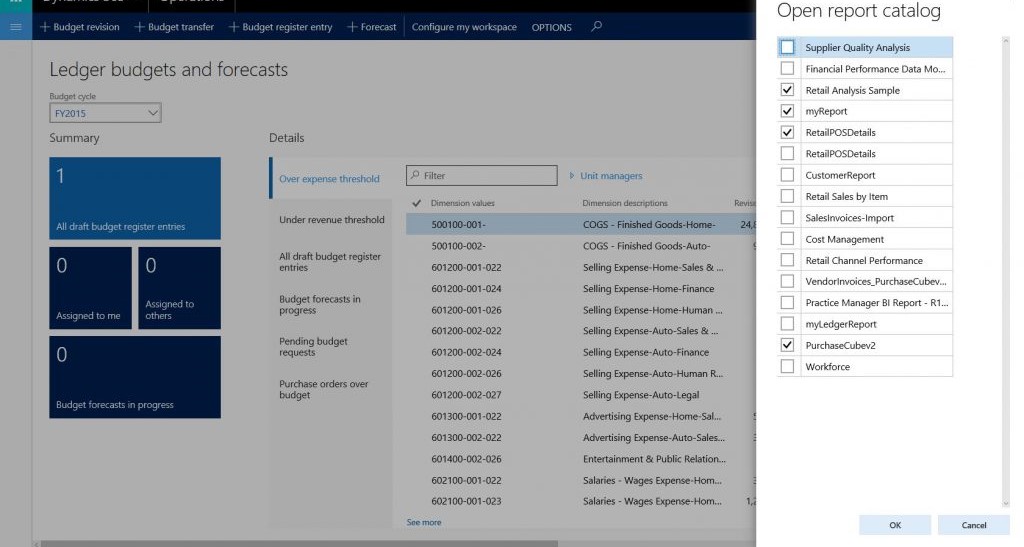
Microsoft Dynamics AX platform update 1 (May 2016) introduced the capability to pin Power BI reports to workspaces. Power BI reports can be added to any workspace that contains a Links section. In other words, the reports can be added to most of the out-of-box workspaces that are included in the product. To enable Power BI reports and tiles, you must configure Power BI to work with the application. This one-time operation must be completed by an administrator of the environment. For instructions, see Configure Power BI integration for workspaces. After you've configured Power BI to work with the application, open the Ledger budgets and forecasts workspace in the client. In the workspace, click the Options tab. Notice that this tab contains buttons to open the (Power BI) tile catalog and the (Power BI) report catalog. Click Open report catalog. A dialog box that contains a list of reports appears. The list of reports comes from the reports that you have in your Power BI account. If you open PowerBI.com in a browser, you will see that the same list of reports is used across your Power BI dashboards. Select some reports, as shown in the following illustration, and then click OK to continue.
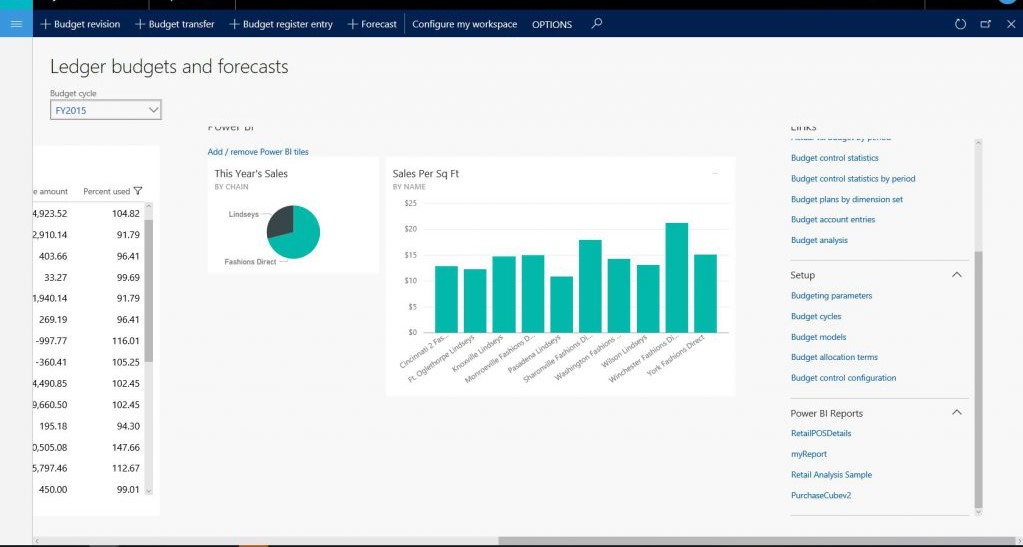
Next, scroll to the bottom of the Links section in the workspace. Notice that a new section for Power BI reports has been added to your links.
Full-page Power BI reports in the client
You can open and run Power BI reports in the client. The functionality resembles the functionality for running Microsoft SQL Server Reporting Services (SSRS) reports. To run a Power BI report, in the Links section, click the link for one of the Power BI reports. For this example, click the Retail Analysis Sample link. The Power BI report is opened in the client in a full-page view, as shown in the following illustration. This report is interactive. As you click regions of the report, the remaining visuals react to your selection.
You can filter the data on the report by using the filter pane. The following illustration shows the report after filters have been applied.
You can also open this report on PowerBI.com and make changes. You can then save the modified report as another copy that has a different name, and even pin the new report to the workspace.
Power BI in user-created workspaces
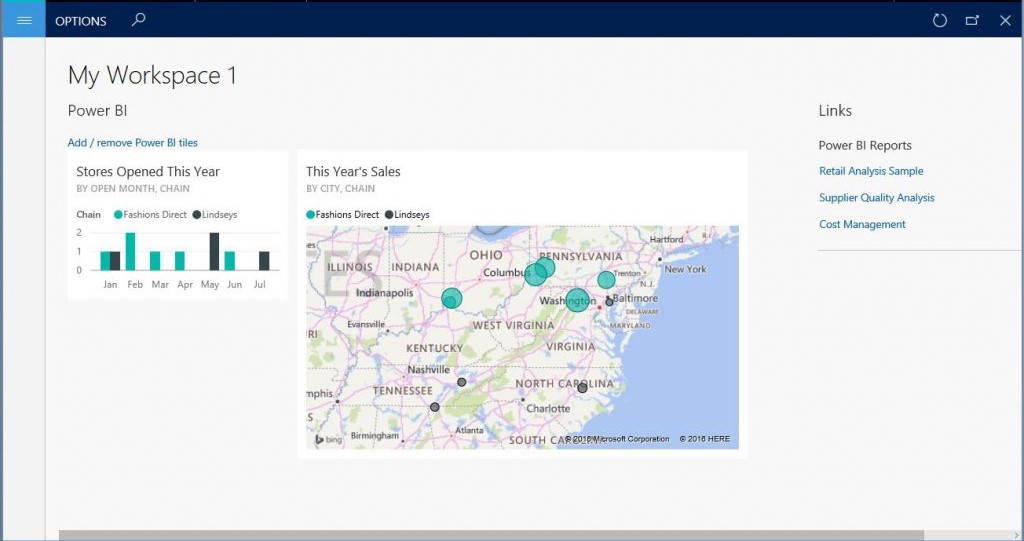
So far, we have described how to add Power BI tiles and reports to "developer-created" workspaces. Developer-created workspaces are workspaces that are created by Microsoft (that is, they are built into the product), by your independent software vendor (ISV) or partner, or by in-house developers. However, in Microsoft Dynamics AX platform update 1 (May 2016), users can create new workspaces by using the personalization capabilities of the client. To create a new workspace, on the home page (or the dashboard), right-click the tile for a workspace, and then click Add a workspace. A new workspace is created. New workspaces are named My Workspace 1, My Workspace 2, and so on. You can change the name later. Click the workspace that you just created. You can now add Power BI tiles and reports by using the same options that we discussed earlier. The following illustration shows an example.


