Start GPU Debugging in Visual Studio 2012
There is fantastic debugging support for C++ AMP in Visual Studio 2012, and in this post I’ll show you how easy it is to get started.
1. Create a new "Hello World" project
Follow the steps described in an earlier post to create the "Hello World" project. Do not try this on one of your projects yet, try it with our "Hello World" first, building under the default Debug configuration.
2. Add breakpoints
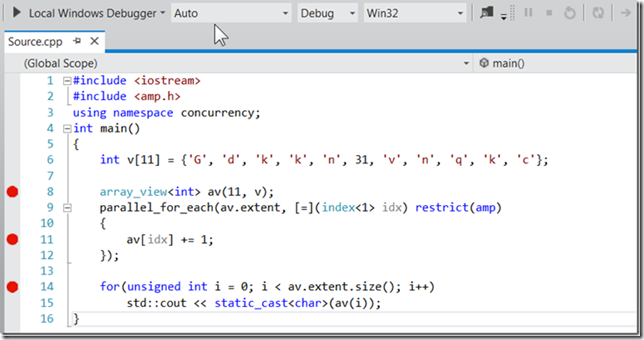
Add three breakpoints on lines 8, 11, and 14. See the following screenshot.
3. Hit F5 to test CPU debugging
Hit the F5 key (or Debug->Start Debugging menu) to start debugging as normal, and you should see something like the following screenshot
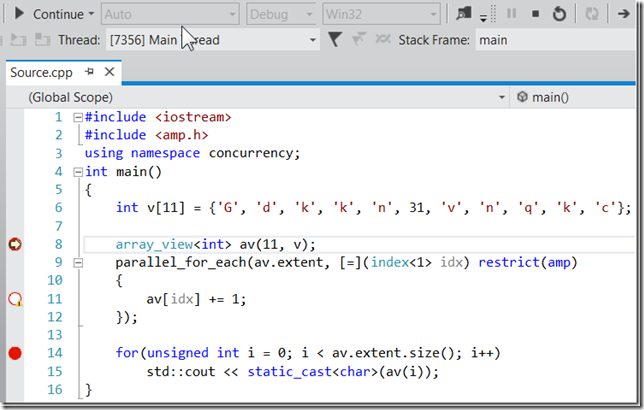
Notice that the breakpoint on line 11, the one in restrict(amp) code, is shown as an unbound breakpoint and it will not be hit. If you continue execution (e.g. F5 again) you will break again on line 14.
That is what the hollow breakpoint icon is trying to convey, which if you zoom in on with the editor you will also see the yellow warning triangle.

In fact if you hover over it you will see this tooltip:

The clue is in the last part of the sentence: "the target architecture of this line is not supported by the current debugger code type". What it is saying is that your selected debug engine is not capable of debugging restrict(amp) code. You select a debug engine by selecting the “Debugger Type” in the project properties. If you do not select one, a default is used. By default, we expect you prefer debugging your CPU code.
So if you want to debug your restrict(amp) code, you need to change the Debugger Type - on to the next section.
4. Configure project properties
Stop debugging (Shift+F5) and change the selected debug engine as discussed previously. I.e. from the "Project" menu select "Properties" and under "Configuration Properties" select the "Debugging" node.
Background Info:
Notice how the Debugger Type is set to "Auto". Other options include "Native Only" (to use the native debug engine to debug native code on the CPU) and "Managed Only" (to use the managed debug engine for debugging code under the .NET CLR). The default "Auto" option means it will select the right CPU debug engine based on the contents of the binary. In the C++ AMP case, it is valid that you may want to debug using the native CPU debug engine or you may want to debug using the GPU engine, so we chose the default to be the native debug engine. As hinted previously when discussing the attach scenario, you cannot select them both. In some future release, we hope to be able to have the two debug engines (native and GPU) co-exist side-by-side in the same debugging session, and that is an aspiration rather than a commitment. So for Visual Studio 11 the story will remain the same as it is for the Beta.
Now, change "Debugger Type" from "Auto" to "GPU Only" and you will see this screenshot
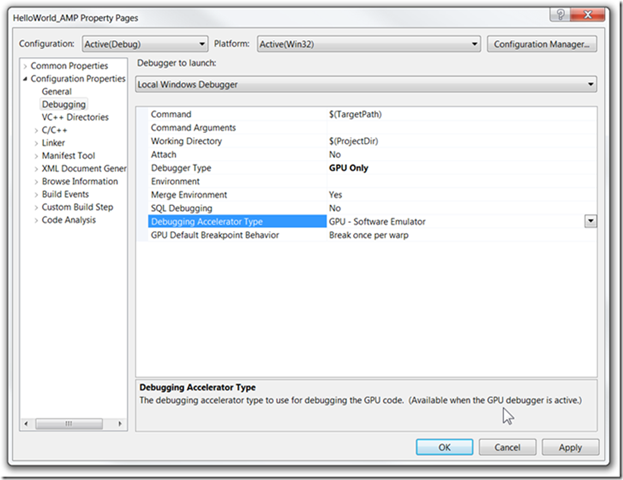
Notice that when you choose "GPU only" two additional property options appear. We'll talk about both of them in future posts, but for now suffice to keep the defaults, and notice that the "Debugging Accelerator Type" is set to "GPU - Software Emulator".
5. Hit F5 to test GPU debugging
With that single project configuration change, you can now hit F5 and your breakpoints in restrict(amp) code will be hit, as the following screenshot shows.
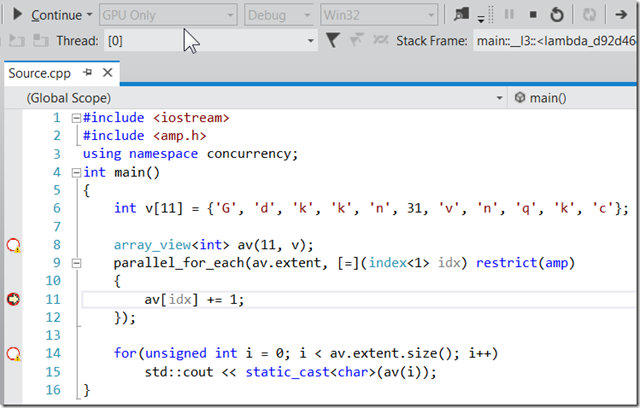
Of course, now you cannot debug your restrict(cpu) code in the same debugging session, and those breakpoints become hollow, and carry the same tooltip message. C'est la vie.
So, at this point you are debugging against the REF emulator, which is great - you don't even need capable hardware for debugging!
If you are not running Windows 8 on your main C++ AMP development machine, continue to the next step.
6. Dealing with error on Windows 7
If you try the above with VS 2012 on Windows 7, you'll be able to achieve all steps except at step 5 when you hit F5 you might see the following error:
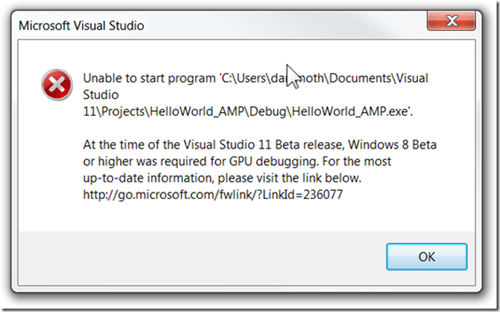
We have added support for C++ AMP debugging on Windows 7. To try out GPU debugging on Windows 7, please refer to C++ AMP GPU debugging now available on Windows 7 blog post.
To try out GPU debugging on Windows 7, you need to apply the latest Windows updates. If for some reason you cannot update your machine, a workaround that may be good for some scenarios is to continue with Visual Studio 2012 installed on your main development machine on Windows 7 and then remote debug to Windows 8 on a remote machine (or a VM that you run on your local machine). We describe that process in the blog post on Remote GPU Debugging in Visual Studio 11.
Potential debugging gotcha for your own code
So now that you can debug the "Hello World" project with the GPU debugger, you are ready to try GPU debugging with your own code.
You will have noticed that the code above does not explicitly specify an accelerator, which means that it is using the default accelerator picked by the runtime. We have done some magic so when you select the GPU debugger, we switch the default accelerator to the “Debugging accelerator type” selected in the project properties. When you are running in release mode or not using the GPU debugger, the default will of course be what we consider the best on your system, as described in the default accelerator post.
However, if you are not relying on the default accelerator, and instead you are explicitly specifying an accelerator_view directly in your code, then you will probably not be running on REF, so your breakpoints will not be hit (unless you have GPU hardware debugging support, which is a topic for another day). So in that case you should change your C++ AMP code to explicitly use the REF accelerator, and then the GPU debugger will work for you again. For example if you were passing your own accelerator_view to parallel_for_each, you would change it in debug mode to be like this:
accelerator_view acc_view = accelerator(accelerator::direct3d_ref).default_view
parallel_for_each(acc_view, av.extent, …
Next steps
The next steps for us in the GPU debugging story is to talk about the two additional options in the project properties I mentioned above (including debugging on GPU hardware), and to talk about the very rich GPU and parallel debugging experience in Visual Studio 2012: hitting breakpoints, stepping and Run To Cursor, inspecting variables and call stacks, Debug Location Toolbar, GPU Threads, Parallel Stacks, Thread Markers, Parallel Watch, Flagging threads, Freezing threads, Run Current Tile To Cursor, inspecting Registers, raw Memory and bytecode through Disassembly debugging, and.... the C++ AMP race detection tool through GPU Memory Access Exceptions! Stay tuned.
For now, please try the steps above, and I have already attached the "Hello World" project for you to download. Beyond that, I recommend following the more complete GPU debugging walkthrough on MSDN. If you have questions, please leave them below in the comments.
Comments
Anonymous
June 20, 2012
Do you have a clear schedule of supporting GPU debug on Windows 7? Thanks a lot.Anonymous
June 20, 2012
Hi "When debugging GPU is support on Windows7", sorry there is still no clear schedule so this is still the best workaround: blogs.msdn.com/.../remote-gpu-debugging-in-visual-studio-11.aspx I will update the blog post when I have news to share...Anonymous
October 18, 2012
We really need this!Anonymous
October 26, 2012
Any update now that Windows 8 is out?Anonymous
October 29, 2012
Hi "Windows 7 debugging support?", sorry we still do not have anything to announce about support for windows 7 debugging.Anonymous
November 01, 2012
@bobyg, I hope you guys treat this as serious issue because we won't use amp until it supports 7 or years down the road when we will be so vested in OpenCL (Which we already are). I don't know anyone development OpenCL who is updated to Win8.Anonymous
November 01, 2012
Oh I see you posted that you are working it on another site. Thanks!Anonymous
November 30, 2012
Can't use windows 8 need a win7 solution please?Anonymous
December 15, 2012
Still no updat on this?Anonymous
January 17, 2013
Well MS I'm out. Keep your ampAnonymous
January 25, 2013
We are happy to announce that you can now try out GPU debugging on windows 7. Please refer to the blogs.msdn.com/.../c-amp-gpu-debugging-now-available-on-windows-7.aspx for more details.