ETW Event Tracing in WPF
Event Tracing for Windows (ETW) provides application developers the ability to start and stop event tracing sessions, instrument an application to provide trace events, and consume trace events.
In addition to Windows itself, WPF also emits an array of interesting events that can be used to track the execution of an application at the framework level.
Mike Cook wrote a great document that explain the various ETW events emitted by WPF.
Check out the this documentation here.
You are encouraged to use these events to measure and analyze your WPF application performance.
The WpfPerf tool for example, use these events extensively. In addition, the WPF team is also using ETW in its automated tests to analyze WPF performance and catch regressions.
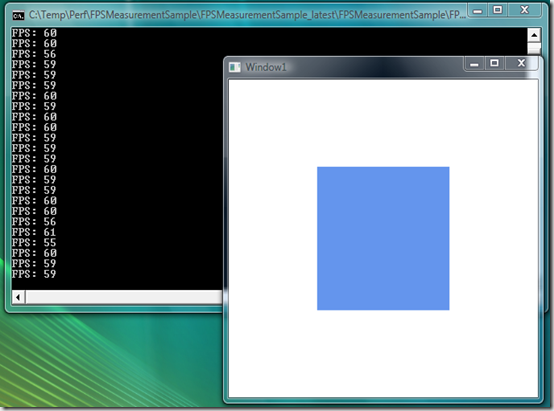
Attached is also a sample that demonstrates how you can consume one of these events (UceNotifyPresent event) to measure frame-rate (aka FPS , Frame-per-Second) in a WPF application.
The sample animates a rectangle and outputs the FPS to a command window . It is writing to a command window and not to the main app window so that it will not affect the real FPS.

You should expect to see frame-rate tied to the refresh rate of your monitor.
Special thanks to Mike Cook and TJ Hsiang who helped put this sample together.
Comments
Anonymous
September 25, 2008
PingBack from http://www.easycoded.com/etw-event-tracing-in-wpf/Anonymous
September 26, 2008
The WPFPerf tool comprises of a suite of performance profiling tools that allow you to analyze the runAnonymous
September 26, 2008
I uninstalled the old WPF Perf Suite and installed the new x64 bits on a Vista machine (.NET 3.5 SP1, VS 2008 SP1) It now crashes when WpfPerf is starting. Could not load file or assembly 'WpfPerf, Version=0.0.0.0, Culture=neutral, PublicKeyToken=31bf3856ad364e35' or one of its dependencies. Strong name validation failed. (Exception from HRESULT: 0x8013141A) Is there a registry key/old file that might be causing this?Anonymous
October 10, 2008
Yes , there were some issues w/ x64 & w/ x86 on non-US PCs. On 10/9/2008 we posted an update. See: http://windowsclient.net/wpf/perf/wpf-perf-tool.aspxAnonymous
October 27, 2008
Thinking about profiling your WPF applications to find out where the performance bottlenecks are? CheckAnonymous
November 02, 2008
I've been a bit busy of late and new and interesting stuff keeps piling into my inbox without enoughAnonymous
June 08, 2010
I know it has been some time somebody posted a comment. My, is a question rather than a comment: I am trying to profile WPF rendering using ETW. The idea is to collect timing needed for rendering of different tree elements (similar to Visual profiler in WPF Performance Profiling Tool). I am able to receive measure, layout and arranged events (start and stop) but I am not able to find any documentation regarding interpretation of the data I am receiving in EVENT_TRACE header. Is there any documentation regarding this area? How can I identify tree elements and calculate rendering time for any given element in a tree?Anonymous
July 10, 2012
Does this sample allow calculation on individual elements? Or is that even possible? Maybe render performance is only possible to trace for an entire WPF window? If it is possible to identify specific elements within the WPF tree, would I do that from the trace object, or the trace.Header object in the samplke, when the EtwEventCallback is made? Thanks!