An in depth look at the Historical Debugger in Visual Studio 2010 (Part I)
In one of my earlier blogs, I introduced a new feature in Visual Studio 2010 called the Historical Debugger that truly transforms how you debug applications. In this blog and subsequent blogs, I’m going to cover in depth how and when to use the Historical Debugger. The Historical Debugger supports six mainline scenarios:
- Application Event Recording
- Playback Debugging (a.k.a Time Travel Debugging)
- Record and Playback of Manual Test Failures
- Debugging Build Acceptance Tests
- Diagnosing Unit Test Defects
- Debugging Load Test Failures
In this blog, I’m going to cover the first scenario, i.e. Application Event Recording.
Application Event Recording
There are many ways to try and figure out what an application is doing. You can use a debugger, add trace statements to your code, use utilities like ProcMon (from sysinternals) to look at file, registry, network, etc. activities. And the list goes on and on. The main drawback with the current approach is that a) in many instances, you have to change your code to add debugging statements and hope that these won’t get into the production code and b) you have to learn new tools and practices, meaning you can't leverage your existing investments in have learned Visual Studio. The Historical Debugger combines all these functionalities into one tool which records and displays a variety of events. Here are a few examples of these events:
- Exceptions
- File access
- Registry access
- User gestures, e.g. button click, checkbox selection, etc.
- Debug.WriteLine()
- etc.
One thing to mention is that the list of recorded events is completely customizable so you can configure which events to record as well as what to record about each event.
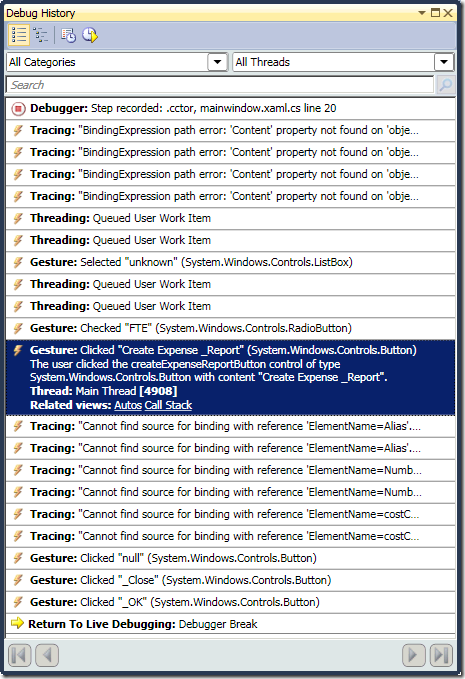
For this demo, I’m using the ExpenseIt WPF sample application. The screenshot below shows the "Debug History" window after running the ExpenseIt application. It shows all the events that happened from the moment that the application started to when I paused the application in the debugger. You can already see how useful this could be in helping the user understand what the application is doing. For example, in the screenshot below, you can see that there are a few "BindingExpression path errors". Also, you can see that the "FTE" checkbox is checked and that the user clicked the "Create Expense_Report" button. In a nutshell, the Debug History window is showing the history of what the application was doing in chronological order. But what makes this feature really useful is that the user can double-click on any of these events and navigate to the location in source code where the event happened.

To see additional events, you can go to Tools.Options.Historical Debugging.Diagnostic Events and select additional events to display. If you don’t see an event, you can customize the list by adding your own.
Habib Heydarian.
Comments
Anonymous
June 02, 2009
PingBack from http://www.anith.com/?p=44092Anonymous
June 10, 2009
In part III of the coverage of the Historical Debugger, I’m going to look at another scenario of the