Troubleshooting REDO queue build-up (data latency issues) on AlwaysOn Readable Secondary Replicas using the WAIT_INFO Extended Event
PROBLEM
You have confirmed excessive build up of REDO queue on an AlwaysOn Availability Group secondary replica by one of the following methods:
- Querying sys.dm_hadr_database_replica_states and observing a high value for redo_queue_size
- You have looked at the redo_queue_size in the dashboard view for an AlwaysOn secondary replica
- You have observed a high value for the recovery queue counter in the Perfmon SQLServer:Database Replica object.
You may also observe some of the following symptoms:
- Excessive transaction log file growth on all replicas (primary & secondary)
- Data is “missing” when querying a readable secondary replica database.
- Long failover times
CAUSE
There are several potential causes for REDO queue build-up or observed data latencies when querying a readable secondary replica database. These include (but may not be limited to):
- Long-running active transactions
- High network latency / low network throughput
- Blocked REDO thread
- Shared REDO Target
The following two articles provide excellent explanations and guidance for each of those causes:
- Troubleshoot: Changes on the Primary Replica are not Reflected on the Secondary Replica
- Recovery On Secondary Lagging – Shared Redo Target
This article focuses on another cause - resource contention. In this context, resource contention means that the REDO thread is waiting on one or more resources due to other activity on the secondary replica. These resources could be a lock (REDO blocking), disk I/O, RAM or even CPU time.
This article provides a method for using the WAIT_INFO extended event to identify the main resources on which the REDO thread is waiting. By following the techniques described in this article, one can determine more specifically where to focus on contention issues. This article is not intended to be a comprehensive discussion of SQL Server extended events, but how the WAIT_INFO XEvent can be used to help determine why the REDO thread may be falling behind. For information on extended events, please refer to the references section at the end of this article.
WAIT_INFO event – what is it?
The WAIT_INFO XEvent logs when a non-preemptive worker thread in SQL Server enters or leaves a “wait state”. (note: pre-emptive threads have their own event: WAIT_INFO_EXTERNAL). If a thread needs to wait for an I/O to complete for example, the WAIT_INFO XEvent will fire when it begins waiting on the I/O and then again when the I/O completes and the thread resumes.
The default fields included in the WAIT_INFO event are:
wait_type Value representing the type of wait. opcode Value representing BEGIN (0) or END (1) depending upon if entering the wait or leaving it. duration The total amount of time (in milliseconds) the thread was waiting before it resumed. signal_duration The time (in milliseconds) between the thread being signaled that the wait condition is over and the time the thread actually resumes executing. In other words, the time the thread spent on the scheduler’s “runnable” list waiting to get on the CPU and run again.
How can I use it?
By capturing the WAIT_INFO event when it is leaving (OPCODE = 1), the duration will indicate exactly how long the thread waited on that particular wait type. Grouping by wait_type and aggregating the duration (and signal_duration) values will provide a breakdown of which wait types were encountered by the thread, how many times that wait was encountered, and how long the thread waited in each wait type. In essence, it provides similar information as sys.dm_os_wait_stats in real-time for a thread or session id.
How to configure?
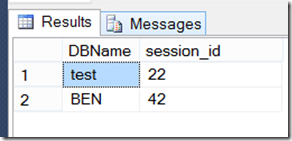
On the SQL Server hosting the secondary replica of a given availability group, each database has a single REDO thread with its own session_id. To get a list of all of the redo threads on a given secondary replica instance (across all availability groups), issue the following query which will return the session_ids performing “REDO” -- otherwise known as “DB STARTUP”.
 SELECT db_name(database_id) as DBName,
    session_id FROM sys.dm_exec_requests
    WHERE command = 'DB STARTUP'
Once we have the session_id(s) to monitor, we can then configure an extended event session to capture the WAIT_INFO events for only the session_id(s) of interest. This is important because the WAIT_INFO event can be fired quite extensively in a busy system. Even when limiting to REDO specific session_ids, it can generate a lot of data very quickly.
Note – for a given secondary replica database – if the REDO thread is completely caught up and there is no new activity on the primary, this thread will eventually be closed and returned to the HADR thread pool, so it is possible you may not see any active session_id for a given database – or that the session_id can change for a given database. However, in busy systems, where there are new transactions constantly taking place on the primary, the REDO thread will remain active and have the same session_id for extended periods of time.
The following script will create an extended event session that collects WAIT_INFO events for session_id 41 when they are leaving the wait (opcode = 1). In addition to the default data collected by the WAIT_INFO event itself, additional actions are included to collect:
event_sequence To get the exact sequence of events in case order is important in further investigation session_id In case more than one REDO thread is being monitored, it is possible to know which event belongs to specific sessions. database_id To validate the session_id is still performing REDO on the database of interest (in case REDO threads were closed due to inactivity and re-started later.) scheduler_id For further investigation if there is evidence of scheduler contention – so that you know on which scheduler the REDO thread is executing.
 CREATE EVENT SESSION [redo_wait_info] ON SERVER
ADD EVENT sqlos.wait_info(
    ACTION(package0.event_sequence,
        sqlos.scheduler_id,
        sqlserver.database_id,
        sqlserver.session_id)
    WHERE ([opcode]=(1) AND
        [sqlserver].[session_id]=(41)))
ADD TARGET package0.event_file(
    SET filename=N'redo_wait_info')
WITH (MAX_MEMORY=4096 KB,
    EVENT_RETENTION_MODE=ALLOW_SINGLE_EVENT_LOSS,
    MAX_DISPATCH_LATENCY=30 SECONDS,
    MAX_EVENT_SIZE=0 KB,
    MEMORY_PARTITION_MODE=NONE,
    TRACK_CAUSALITY=OFF,STARTUP_STATE=OFF)
GO
NOTE: By default, the above session definition will create the redo_wait_info.XEL file in your SQL Server Instance \LOG directory. Be sure there is sufficient disk space available on this drive.
Once you have the extended event session defined, start it using the SQL Server Management Studio (SSMS) GUI or TSQL, collect for a short period of time and then stop the collection. It is advisable that the first time a collection is done on a busy system, the collection period is for no more than 30 to 60 seconds. While extended events are light weight, it is still possible to negatively affect production and generate a large amount of data very quickly. Once you have determined the impact to your system, collections for longer intervals can be attempted.
The following TSQL will start the extended event session, wait for 30 seconds and then stop the session:
 ALTER EVENT SESSION [redo_wait_info] ON SERVER STATE=START

WAITFOR DELAY '00:00:30'

ALTER EVENT SESSION [redo_wait_info] ON SERVER STATE=STOP
Open and Aggregate Data for Review
This section describes how to open, group and then aggregate the collected data to produce a concise presentation of the data that will facilitate quicker analysis.
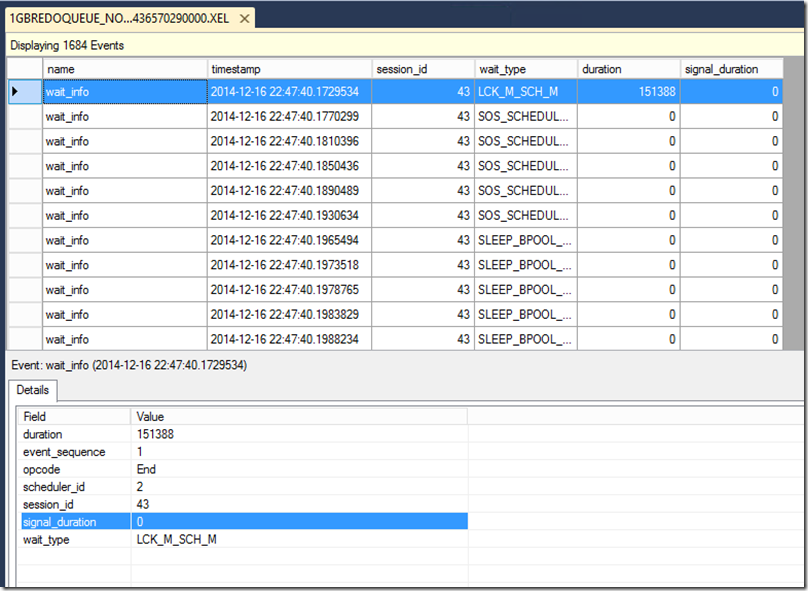
In SSMS, open the session and then click on one of the WAIT_INFO events so that the data elements can be seen on the Details pane. Right click each of the highlighted fields and choose “Show Column in Table”
The details now appear as columns in the table of events:
Click the Grouping button to begin grouping the events – first by session_id and then by wait_type:
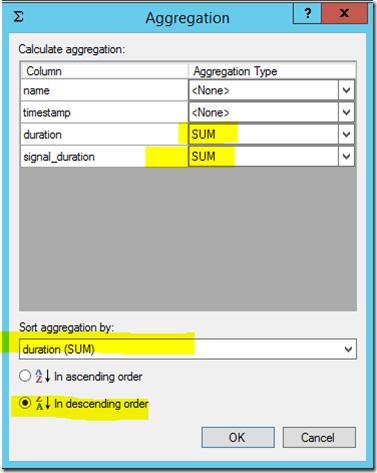
Then after grouping by session_id and wait_type, you can add Aggregation. Click the Aggregation button:
Add SUM for both duration and signal_duration and sort the aggregation by duration (SUM) in descending order.
The resulting output shows the wait_types (with count of events in parentheses) and the aggregated sum of duration and signal duration – ordered by the highest wait_type duration in descending order:
Analyze the Captured Data
The following two test scenarios were conducted to help illustrate analyzing the collected data to determine any resource contention a REDO thread may be experiencing.
Scenario 1: Blocked REDO due to large query on the secondary replica
This test was done to simulate a common scenario: a blocked REDO thread causing the REDO queue to build up on the secondary.
We captured WAIT_INFO Xevent data for the entire time while the REDO thread was blocked and then afterward while it processed the large REDO queue that had built up.
The testing configuration used to capture this data was the following:
- On the primary, generate transactions to generate log blocks that will ship to the secondary replica.
- Execute a large query on the secondary (simulating a report for example)
- Create a blocked REDO condition by performing a DDL operation on the primary while the large query runs on the secondary.
- Begin capturing the WAIT_INFO XEvent data on the secondary replica.
- Maintain the REDO blocking condition on the secondary.
- Continue generating transactions on the primary until the secondary REDO queue size reaches 1GB in size.
- Stop the process on the primary so additional logs are not generated.
- Kill the long running query on the secondary replica so that REDO can resume.
- Continue collecting the extended event data until the REDO queue reaches 0.
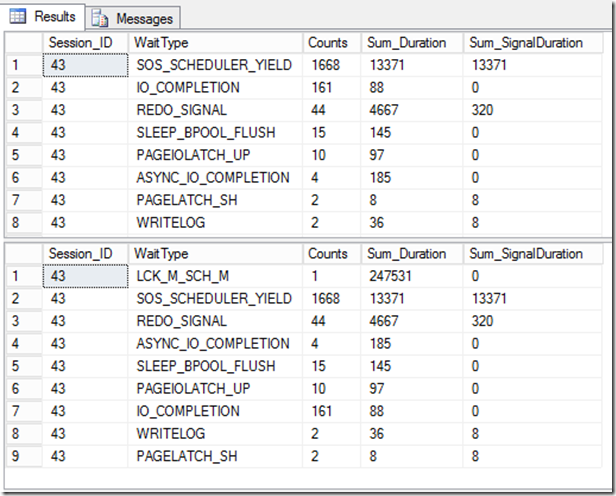
The total extended event collection time was approximately 158.5 seconds. The picture below shows the aggregated wait_type data during this test run.
As can be seen from the descending aggregated data, the primary resource on which the REDO thread waited was LCK_M_SCH_M. This is the resource on which a blocked REDO thread will wait. In this case, we see that the REDO thread was only blocked once for a total time of approximately 151.4 seconds.
Once the blocking situation was removed, it took approximately 7 more seconds for the 1GB REDO queue to be completely processed and caught up. During these last 7 seconds there were only two significant resource types on which the REDO thread waited – REDO_SIGNAL (~92%) and IO_COMPLETION (~8%). This essentially shows that once the blocking situation was removed, there was no significant resource contention slowing down the REDO processing.
Scenario 2: Blocked REDO due followed by CPU contention on the secondary replica
This test was modified to demonstrate a scenario where the REDO thread is competing for CPU resources on the secondary replica – a condition that could exist when the secondary is used for heavy read-only processing (reporting for example).
Essentially the test scenario began the same as in the first scenario. The main difference being that before the blocking condition was removed, we added two client sessions each performing CPU intensive queries on the same scheduler as the REDO thread – thus creating a situation where the REDO thread is competing against other sessions for CPU resources.
We captured WAIT_INFO Xevent data for the entire time while the REDO thread was blocked and then afterward while it processed the large REDO queue that had built up.
The testing configuration used to capture this data was the following:
- On the primary, generate transactions to generate log blocks that will ship to the secondary replica.
- Execute a large query on the secondary (simulating a report for example)
- Create a blocked REDO condition by performing a DDL operation on the primary while the large query runs on the secondary.
- Begin capturing the WAIT_INFO XEvent data on the secondary replica.
- Maintain the REDO blocking condition on the secondary.
- Continue generating transactions on the primary until the secondary REDO queue size reaches 1GB in size.
- On the secondary, start two sessions on the same scheduler as the REDO thread. Both of these sessions were CPU intensive – with no disk I/O. (CPU utilization for this core went to 100% during these tests.)
- Stop the process on the primary so additional logs are not generated.
- Kill the long running query on the secondary replica so that REDO can resume.
- Continue collecting the extended event data until the REDO queue reaches 0.
The total extended event collection time was approximately 266 seconds. The picture below shows the aggregated wait_type data during this test run.
As in the first scenario, the largest wait_type on which the REDO thread waited was LCK_M_SCH_M – waiting 1 time for 247.5 seconds. After the blocking situation is removed however, we see a very different picture when compared to the first scenario. First, it took another 18.5 seconds to process the 1GB queue instead of the 7 seconds in the first scenario. Then instead of predominately waiting on REDO_SIGNAL, we see 72% of the time (13.371/18.5) the REDO thread waited on SOS_SCHEDULER_YIELD.
There were 1668 times that the REDO thread voluntarily yielded the CPU to let other threads run – by design. But the duration and signal_duration values we see tell us that each time the REDO thread yielded – it had to wait again to get back onto the CPU. The two other sessions we introduced were contending for CPU time on the same scheduler. This is normal, but we are looking for excessive wait times. Every time the REDO thread yielded, it had to wait an average of 8ms before it got back onto the CPU (duration 13371 / 1668 ). While it doesn’t seem like much, in aggregate, it was over 72% of the time - waiting on CPU.
Due to the fact that the signal_duration was equal to the duration when the REDO thread yielded:
1) REDO was predominantly waiting on CPU
2) it had to wait an average of 8ms before it got back onto the CPU (because of other running threads)
3) the entire time it was waiting to get back on the CPU -- (signal_duration = duration) it was in the runnable list waiting to execute – meaning it wasn’t waiting on anything else other than to have its turn back on the CPU.
4) the two other sessions were the primary factor in slowing down REDO processing during this test run.
Conclusions
Using the WAIT_INFO XEvent is a simple way to capture the various waits that a REDO thread is experiencing which can give important clues in troubleshooting slow REDO operations in AlwaysOn.
Sample scripts
The following two sample scripts are provided (see attached SampleScripts.zip file below) to help demonstrate using WAIT_INFO XEvents to see what REDO threads are waiting on.
The first script, Collect_WaitInfo_For_REDO.sql will dynamically determine which session_ids are currently performing REDO activities and create an extended event session that will filter on those specific session_ids. It will start the session, wait one minute and then terminate the session.
The second script, Shred_Wait_Info_Xevent.sql, will take the file collected from the first script and return the top wait types by duration and by count – for each session_id that was performing REDO activity. To execute the second script, use the CTRL-SHIFT-M option in query window of SSMS to set the required parameters. There are two parameters – the folder location where the XEL file is stored, and the name of the file (wildcards are accepted) -- see below.
Sample output:
References
The following references provide more information on creating and using extended events.
- Extended Events
- Create an Extended Events Session
- View Event Session Data
- Introducing SQL Server Extended Events
- Using SQL Server Extended Events
Comments
Anonymous
March 19, 2015
wait type redo_sinal is good or bad?tksAnonymous
March 19, 2015
typically redo_signal is a wait type that can be ignored.Anonymous
March 20, 2015
Hi,Thank you for previous answer and by the way this is a fantastic article.One more question, changes in primary replica take more than 1 second to reflect on the secondary replica and is lacking redo blocks nor REDO_THREAD_PENDING_WORK, what could it be? or how can I optimize?Thank you very much!Anonymous
October 08, 2015
@mma500 -- sorry for the delayed response -- i didn't see this question come in. REDO can still take time to actually process the changes to the buffer pool. For a given transaction, its changes will not be visible until the COMMIT log record has been processed by REDO, since all connections to the secondary are in SNAPSHOT_ISOLATION mode and cannot see changes until committed. It is possible to get the timings of when particular log records are processed through additional Xevents. It is unlikely, even after identifying the cause, that we would be able to re-configure anything to get sub-second processing.Anonymous
October 19, 2015
Your article is brilliant. It is exactly what I have been looking for. Tks. =DAnonymous
October 28, 2015
Totally unrelated to this post. I was reading your latatest article "Configure an ILB Listener for Alwayson Availability Group in Azure V2 or Virtual Machines created using Azure Resource Manager (ARM)" before it got taken down. I have configured ILB and AlwaysOn in Azure Classic many times and I am pretty confident I followed these new directions for ARM precisely, yet I am unable to connect to the listener from the passive node. I see that the has since been pulled down. Are there known issues getting ILB to work when following those instructions? When will the article be republished? Please email me at david dot bermingham at us dot sios dot com if you have any guidance. Thanks!Anonymous
May 10, 2016
Thanks for the great article. It has helped troubleshoot our latency issues. The latency issue on our production databases are due to CPU contention on the readable secondary. Large reports are the main reason why we have a readable secondary in the first place. From what I understand processor affinity cannot be set on a re-do thread. Is there anything we can do to reduce the latency?Anonymous
August 22, 2016
The comment has been removedAnonymous
October 22, 2016
Great post Trayce !!"........we added two client sessions each performing CPU intensive queries on the same SCHEDULER as the REDO thread".....May I know how it was accomplished ?Thank you.Anil


