Get started with WinDbg (user mode)
WinDbg is a kernel-mode and user-mode debugger that's included in Debugging Tools for Windows. The following hands-on exercises can help you get started using WinDbg as a user-mode debugger.
For information about how to get Debugging Tools for Windows, see Download and install the WinDbg Windows debugger.
After you install the debugging tools, find the installation directories for the 64-bit (x64) and 64-bit ARM versions of the tools. For example:
- C:\Program Files (x86)\Windows Kits\10\Debuggers\x64
- C:\Program Files (x86)\Windows Kits\10\Debuggers\arm64
Open Notepad and attach WinDbg
Go to your installation directory, and open WinDbg.exe.
On the File menu, select Launch Executable. In the Launch Executable dialog, go to the folder that contains notepad.exe. (The notepad.exe file usually is in C:\Windows\System32.) For File name, enter notepad.exe. Select Open.

In the command line near the bottom of the WinDbg window, enter this command:
The output is similar to this example:
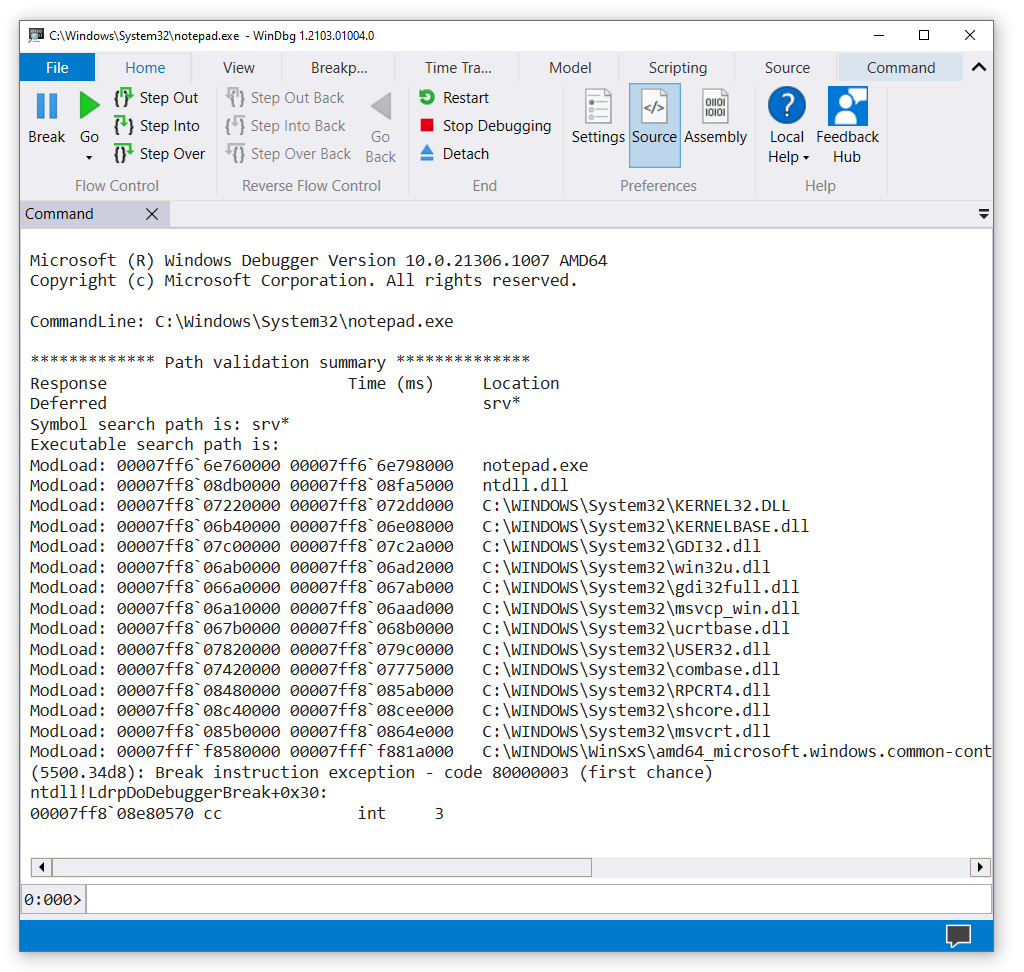
Symbol search path is: srv*
Expanded Symbol search path is: cache*;SRV
The symbol search path tells WinDbg where to look for symbol (PDB) files. The debugger needs symbol files to get information about code modules, like function names and variable names.
Then, enter this command:
The
.reloadcommand tells WinDbg to do its initial search to find and load symbol files.To see the symbols for the notepad.exe module, enter this command:
Note
If no output appears, enter
.reload /fto attempt to force the symbol load. Use !sym noisy to display additional symbol load information.To see symbols in the notepad.exe module that contain
main, use the examine symbols command to list modules that match the mask:x notepad!wWin*The output is similar to this example:
00007ff6`6e76b0a0 notepad!wWinMain (wWinMain)
00007ff6`6e783db0 notepad!wWinMainCRTStartup (wWinMainCRTStartup)
To put a breakpoint at
notepad!wWinMain, enter this command:To verify that your breakpoint was set, enter this command:
The output is similar to this example:
0 e Disable Clear 00007ff6`6e76b0a0 0001 (0001) 0:**** notepad!wWinMainTo start the Notepad process, enter this command:
Notepad runs until it comes to the
WinMainfunction, and then it breaks into the debugger.Breakpoint 0 hit notepad!wWinMain: 00007ff6`6e76b0a0 488bc4 mov rax,rspTo see a list of code modules that are currently loaded in the Notepad process, enter this command:
The output is similar to this example:
0:000> lm
start             end                 module name
00007ff6`6e760000 00007ff6`6e798000   notepad    (pdb symbols)          C:\ProgramData\Dbg\sym\notepad.pdb\BC04D9A431EDE299D4625AD6201C8A4A1\notepad.pdb
00007ff8`066a0000 00007ff8`067ab000   gdi32full   (deferred)
00007ff8`067b0000 00007ff8`068b0000   ucrtbase   (deferred)
00007ff8`06a10000 00007ff8`06aad000   msvcp_win   (deferred)
00007ff8`06ab0000 00007ff8`06ad2000   win32u     (deferred)
00007ff8`06b40000 00007ff8`06e08000   KERNELBASE   (deferred)
00007ff8`07220000 00007ff8`072dd000   KERNEL32   (deferred)
00007ff8`07420000 00007ff8`07775000   combase    (deferred)
00007ff8`07820000 00007ff8`079c0000   USER32     (deferred)
00007ff8`079c0000 00007ff8`079f0000   IMM32      (deferred)
00007ff8`07c00000 00007ff8`07c2a000   GDI32      (deferred)
00007ff8`08480000 00007ff8`085ab000   RPCRT4     (deferred)
00007ff8`085b0000 00007ff8`0864e000   msvcrt     (deferred)
00007ff8`08c40000 00007ff8`08cee000   shcore     (deferred)
00007ff8`08db0000 00007ff8`08fa5000   ntdll      (pdb symbols)          C:\ProgramData\Dbg\sym\ntdll.pdb\53F12BFE149A2F50205C8D5D66290B481\ntdll.pdb
00007fff`f8580000 00007fff`f881a000   COMCTL32   (deferred)
To see a stack trace, enter this command:
The output is similar to this example:
0:000> k
00 000000c8`2647f708 00007ff6`6e783d36     notepad!wWinMain
01 000000c8`2647f710 00007ff8`07237034     notepad!__scrt_common_main_seh+0x106
02 000000c8`2647f750 00007ff8`08e02651     KERNEL32!BaseThreadInitThunk+0x14
03 000000c8`2647f780 00000000`00000000     ntdll!RtlUserThreadStart+0x21
To start Notepad running again, enter this command:
To break into Notepad, on the File menu, select Break.
To set and verify a breakpoint at
ZwWriteFile, enter these commands:To start Notepad running again, enter g. In the Notepad window, enter some text. On the File menu, select Save. The running code breaks in when it comes to
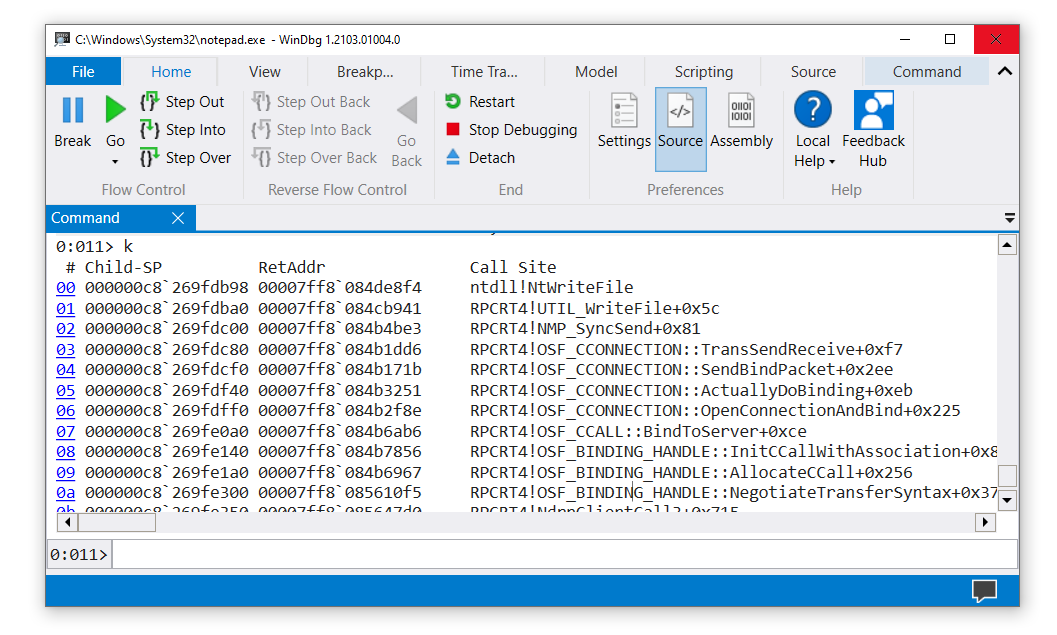
ZwCreateFile. Enter the k command to see the stack trace.
In the WinDbg window, left of the command line, the processor and thread numbers are shown. In this example, the current processor number is 0, and the current thread number is 11 (
0:011>). The window displays the stack trace for thread 11 running on processor 0.To see a list of all threads in the Notepad process, enter this command (the tilde):
The output is similar to this example:
0:011> ~
   0  Id: 5500.34d8 Suspend: 1 Teb: 000000c8`262c4000 Unfrozen
   1  Id: 5500.3960 Suspend: 1 Teb: 000000c8`262c6000 Unfrozen
    2  Id: 5500.5d68 Suspend: 1 Teb: 000000c8`262c8000 Unfrozen
    3  Id: 5500.4c90 Suspend: 1 Teb: 000000c8`262ca000 Unfrozen
    4  Id: 5500.4ac4 Suspend: 1 Teb: 000000c8`262cc000 Unfrozen
    5  Id: 5500.293c Suspend: 1 Teb: 000000c8`262ce000 Unfrozen
    6  Id: 5500.53a0 Suspend: 1 Teb: 000000c8`262d0000 Unfrozen
    7  Id: 5500.3ca4 Suspend: 1 Teb: 000000c8`262d4000 Unfrozen
    8  Id: 5500.808 Suspend: 1 Teb: 000000c8`262da000 Unfrozen
   10  Id: 5500.3940 Suspend: 1 Teb: 000000c8`262dc000 Unfrozen
 . 11  Id: 5500.28b0 Suspend: 1 Teb: 000000c8`262de000 Unfrozen
   12  Id: 5500.12bc Suspend: 1 Teb: 000000c8`262e0000 Unfrozen
   13  Id: 5500.4c34 Suspend: 1 Teb: 000000c8`262e2000 Unfrozen
In this example, 14 threads have indexes 0 through 13.
To look at the stack trace for thread 0, enter these commands:
The output is similar to this example:
0:011> ~0s
0:011> ~0s
win32u!NtUserGetProp+0x14:
00007ff8`06ab1204 c3              ret
0:000> k
 # Child-SP          RetAddr               Call Site
00 000000c8`2647bd08 00007ff8`07829fe1     win32u!NtUserGetProp+0x14
01 000000c8`2647bd10 00007fff`f86099be     USER32!GetPropW+0xd1
02 000000c8`2647bd40 00007ff8`07d12f4d     COMCTL32!DefSubclassProc+0x4e
03 000000c8`2647bd90 00007fff`f8609aba     SHELL32!CAutoComplete::_EditWndProc+0xb1
04 000000c8`2647bde0 00007fff`f86098b7     COMCTL32!CallNextSubclassProc+0x9a
05 000000c8`2647be60 00007ff8`0782e858     COMCTL32!MasterSubclassProc+0xa7
06 000000c8`2647bf00 00007ff8`0782de1b     USER32!UserCallWinProcCheckWow+0x2f8
07 000000c8`2647c090 00007ff8`0782d68a     USER32!SendMessageWorker+0x70b
08 000000c8`2647c130 00007ff8`07afa4db     USER32!SendMessageW+0xda
To quit debugging and detach from the Notepad process, enter this command:
Open your own application and attach WinDbg
For an example, assume that you've written and built this small console application:
...
void MyFunction(long p1, long p2, long p3)
{
    long x = p1 + p2 + p3;
    long y = 0;
    y = x / p2;
}

void main ()
{
    long a = 2;
    long b = 0;
    MyFunction(a, b, 5);
}
For this exercise, assume that the built application (MyApp.exe) and the symbol file (MyApp.pdb) are in C:\MyApp\x64\Debug. Also assume that the application source code is in C:\MyApp\MyApp and that the target machine compiled MyApp.exe.
Open WinDbg.
On the File menu, select Launch Executable. In the Launch Executable dialog, go to C:\MyApp\x64\Debug. For File name, enter MyApp.exe. Select Open.
Enter these commands:
.sympath+ C:\MyApp\x64\Debug
The commands tell WinDbg where to find symbols and source code for your application. In this case, the source code location doesn't need to be set by using .srcpath because the symbols have fully qualified paths to the source files.
Enter these commands:
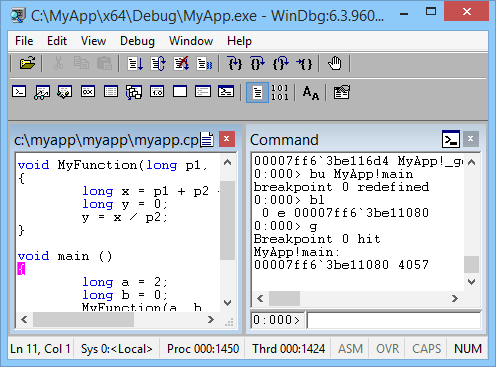
Your application breaks into the debugger when it comes to its
mainfunction.WinDbg displays your source code and the Command window.

On the Debug menu, select Step Into (or select F11). Continue stepping until you step into
MyFunction. When you step into the liney = x / p2, your application crashes and breaks into the debugger.The output is similar to this example:
(1450.1424): Integer divide-by-zero - code c0000094 (first chance)
First chance exceptions are reported before any exception handling.
This exception may be expected and handled.
MyApp!MyFunction+0x44:
00007ff6`3be11064 f77c2428    idiv  eax,dword ptr [rsp+28h] ss:00000063`2036f808=00000000
Enter this command:
WinDbg displays an analysis of the problem (in this case, division by 0).
FAULTING_IP:
MyApp!MyFunction+44 [c:\myapp\myapp\myapp.cpp @ 7]
00007ff6`3be11064 f77c2428        idiv    eax,dword ptr [rsp+28h]

EXCEPTION_RECORD:  ffffffffffffffff -- (.exr 0xffffffffffffffff)
ExceptionAddress: 00007ff63be11064 (MyApp!MyFunction+0x0000000000000044)
   ExceptionCode: c0000094 (Integer divide-by-zero)
  ExceptionFlags: 00000000
NumberParameters: 0
...
STACK_TEXT:
00000063`2036f7e0 00007ff6`3be110b8 : ... : MyApp!MyFunction+0x44
00000063`2036f800 00007ff6`3be1141d : ... : MyApp!main+0x38
00000063`2036f840 00007ff6`3be1154e : ... : MyApp!__tmainCRTStartup+0x19d
00000063`2036f8b0 00007ffc`b1cf16ad : ... : MyApp!mainCRTStartup+0xe
00000063`2036f8e0 00007ffc`b1fc4629 : ... : KERNEL32!BaseThreadInitThunk+0xd
00000063`2036f910 00000000`00000000 : ... : ntdll!RtlUserThreadStart+0x1d

STACK_COMMAND: dt ntdll!LdrpLastDllInitializer BaseDllName ;dt ntdll!LdrpFailureData ;.cxr 0x0 ;kb

FOLLOWUP_IP:
MyApp!MyFunction+44 [c:\myapp\myapp\myapp.cpp @ 7]
00007ff6`3be11064 f77c2428        idiv    eax,dword ptr [rsp+28h]

FAULTING_SOURCE_LINE:  c:\myapp\myapp\myapp.cpp

FAULTING_SOURCE_FILE:  c:\myapp\myapp\myapp.cpp

FAULTING_SOURCE_LINE_NUMBER:  7

FAULTING_SOURCE_CODE:
     3: void MyFunction(long p1, long p2, long p3)
     4: {
     5:     long x = p1 + p2 + p3;
     6:     long y = 0;
>    7:  y = x / p2;
     8: }
     9:
    10: void main ()
    11: {
    12:     long a = 2;
...
Summary of commands
Contentscommand on theHelpmenu- .sympath (Set Symbol Path)
- .reload (Reload Module)
- x (Examine Symbols)
- g (Go)
Breakcommand on theDebugmenu- lm (List Loaded Modules)
- k (Display Stack Backtrace)
- bu (Set Breakpoint)
- bl (Breakpoint List)
- ~ (Thread Status)
- ~s (Set Current Thread)
- .sympath+ (Set Symbol Path) append to existing symbol path
- .srcpath (Set Source Path)
Step Intocommand on theDebugmenu (F11)- !analyze -v
- qd (Quit and Detach)
See also
Get started with WinDbg (kernel mode)