Troubleshoot Breakpoints in the Visual Studio Debugger
Applies to: Visual Studio
Breakpoint warnings
When debugging, a breakpoint has two possible visual states:
- A solid red circle, if the debugger successfully set a breakpoint in the target process.
- A hollow circle (dark grey or white filled, depending on your theme), if the breakpoint is disabled or a warning occurrs when trying to set the breakpoint.
To determine the difference, hover over the breakpoint and see if there's a warning. The following two sections describe prominent warnings and how to fix them.
"No Symbols have been loaded for this document"
Navigate to Debug > Windows > Modules when debugging and check whether your module is loaded.
- If your module is loaded, check the Symbol Status column to see whether symbols have been loaded.
If symbols aren't loaded, check the symbol status to diagnose the issue:
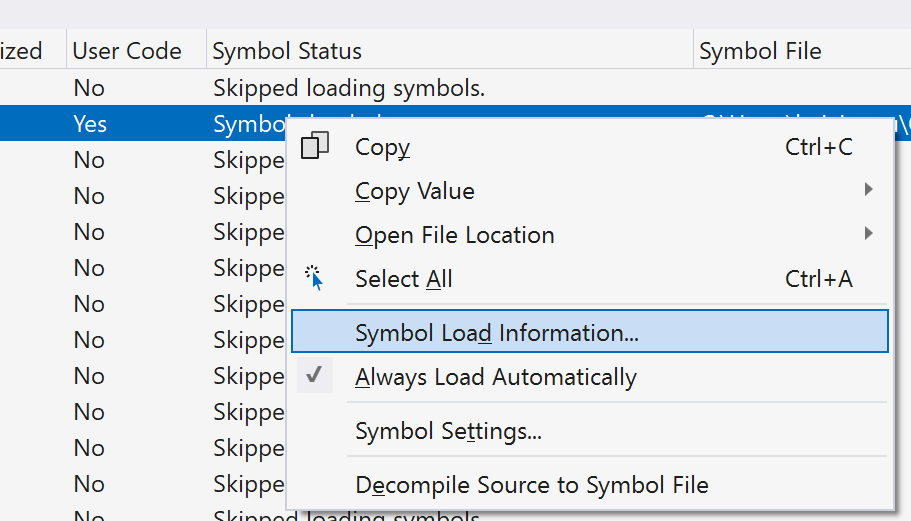
In the Modules window, right-click the module for which symbols haven't loaded and select Symbol Load Information....

For more information about loading symbols, see Specify Symbol (.pdb) and Source Files.
If symbols are loaded, the PDB doesn't contain information about your source files. A few possible causes are:
- If your source files were recently added, confirm that an up-to-date version of the module is being loaded.
- It's possible to create stripped PDBs using the /PDBSTRIPPED linker option. Stripped PDBs don't contain source file information. Confirm you're working with a full PDB and not a stripped PDB.
- The PDB file is partially corrupted. Delete the file and run a clean build of the module to try to resolve the issue.
- If your module isn't loaded, check the following to find the cause:
- Confirm that you're debugging the right process.
- Check to see that you're debugging the right code. You can find out what type of code the debugger is configured to debug in the Processes window (Debug > Windows > Processes). For example, if you're trying to debug C# code, confirm that your debugger is configured for the appropriate type and version of .NET (for example, Managed (v4*) versus Managed (v2*/v3*) versus Managed (CoreCLR)).
"… the current source code is different from the version built into..."
If a source file has changed and the source no longer matches the code you're debugging, the debugger won't set breakpoints in the code by default. Normally, this problem happens when a source file is changed, but the source code wasn't rebuilt. To fix this issue, rebuild the project. If the build system thinks the project is already up-to-date even though it isn't, you can force the project system to rebuild. Rebuild the project either by saving the source file again or by cleaning the build output before building.
In rare scenarios, you may want to debug without having matching source code. Debugging without matching source code can lead to a confusing debugging experience, so make sure how you want to continue.
Follow one of the options to disable these safety checks:
- To modify a single breakpoint, hover over the breakpoint icon in the editor and select the settings (gear) icon. A peek window is added to the editor. At the top of the peek window, there's a hyperlink that indicates the location of the breakpoint. Select the hyperlink to allow modification of the breakpoint location and check Allow the source code to be different from the original.
- To modify this setting for all breakpoints, go to Debug > Options and Settings. On the Debugging/General page, clear the Require source files that exactly match the original version option. Make sure to reenable this option when you're finished debugging.
The breakpoint was successfully set (no warning), but didn't hit
This section provides information to troubleshoot issues when the debugger isn't displaying any warnings – the breakpoint is a solid red circle while actively debugging, yet the breakpoint isn't being hit.
Here are a few things to check:
- If your code runs in more than one process or more than one computer, make sure that you're debugging the right process or computer.
- Confirm that your code is running. To test that your code is running, add a call to
System.Diagnostics.Debugger.Break(C#/VB) or__debugbreak(C++) to the line of code where you're trying to set the breakpoint and then rebuild your project. - If you're debugging optimized code, make sure the function where your breakpoint is set isn't being inlined into another function. The
Debugger.Breaktest described in the previous check can work to test this issue as well. - For attach to process scenarios, make sure you're debugging the right type of code (for example, script code versus .NET Framework versus .NET 5+). To investigate, check the Attach to option in the Attach to Process dialog box, and choose Select, if necessary, to change the code type.
I deleted a breakpoint, but I continue to hit it when I start debugging again
If you deleted a breakpoint while debugging, you may hit the breakpoint again the next time you start debugging. To stop hitting this breakpoint, make sure all the instances of the breakpoint are removed from the Breakpoints window.