Dashboard entities
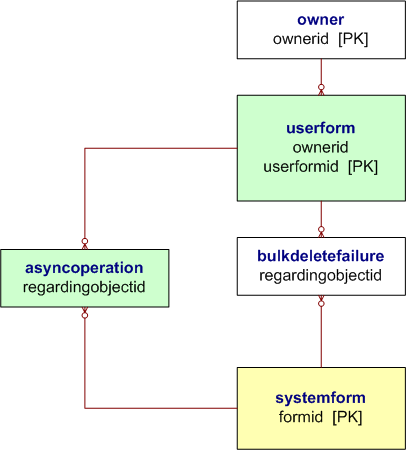
The dashboard entities enable you to simultaneously present data from up to six charts, grids, or IFRAMES. The following illustration shows the entity relationships for this area. More information: Key to Entity Diagrams

Denne nettleseren støttes ikke lenger.
Oppgrader til Microsoft Edge for å dra nytte av de nyeste funksjonene, sikkerhetsoppdateringene og den nyeste tekniske støtten.
The dashboard entities enable you to simultaneously present data from up to six charts, grids, or IFRAMES. The following illustration shows the entity relationships for this area. More information: Key to Entity Diagrams
