Threat hunting in Microsoft Sentinel
As security analysts and investigators, you want to be proactive about looking for security threats, but your various systems and security appliances generate mountains of data that can be difficult to parse and filter into meaningful events. Microsoft Sentinel has powerful hunting search and query tools to hunt for security threats across your organization's data sources. To help security analysts look proactively for new anomalies that aren't detected by your security apps or even by your scheduled analytics rules, hunting queries guide you into asking the right questions to find issues in the data you already have on your network.
For example, one out of the box query provides data about the most uncommon processes running on your infrastructure. You wouldn't want an alert each time they run. They could be entirely innocent. But you might want to take a look at the query on occasion to see if there's anything unusual.
Important
Microsoft Sentinel is generally available within Microsoft's unified security operations platform in the Microsoft Defender portal. For preview, Microsoft Sentinel is available in the Defender portal without Microsoft Defender XDR or an E5 license. For more information, see Microsoft Sentinel in the Microsoft Defender portal.
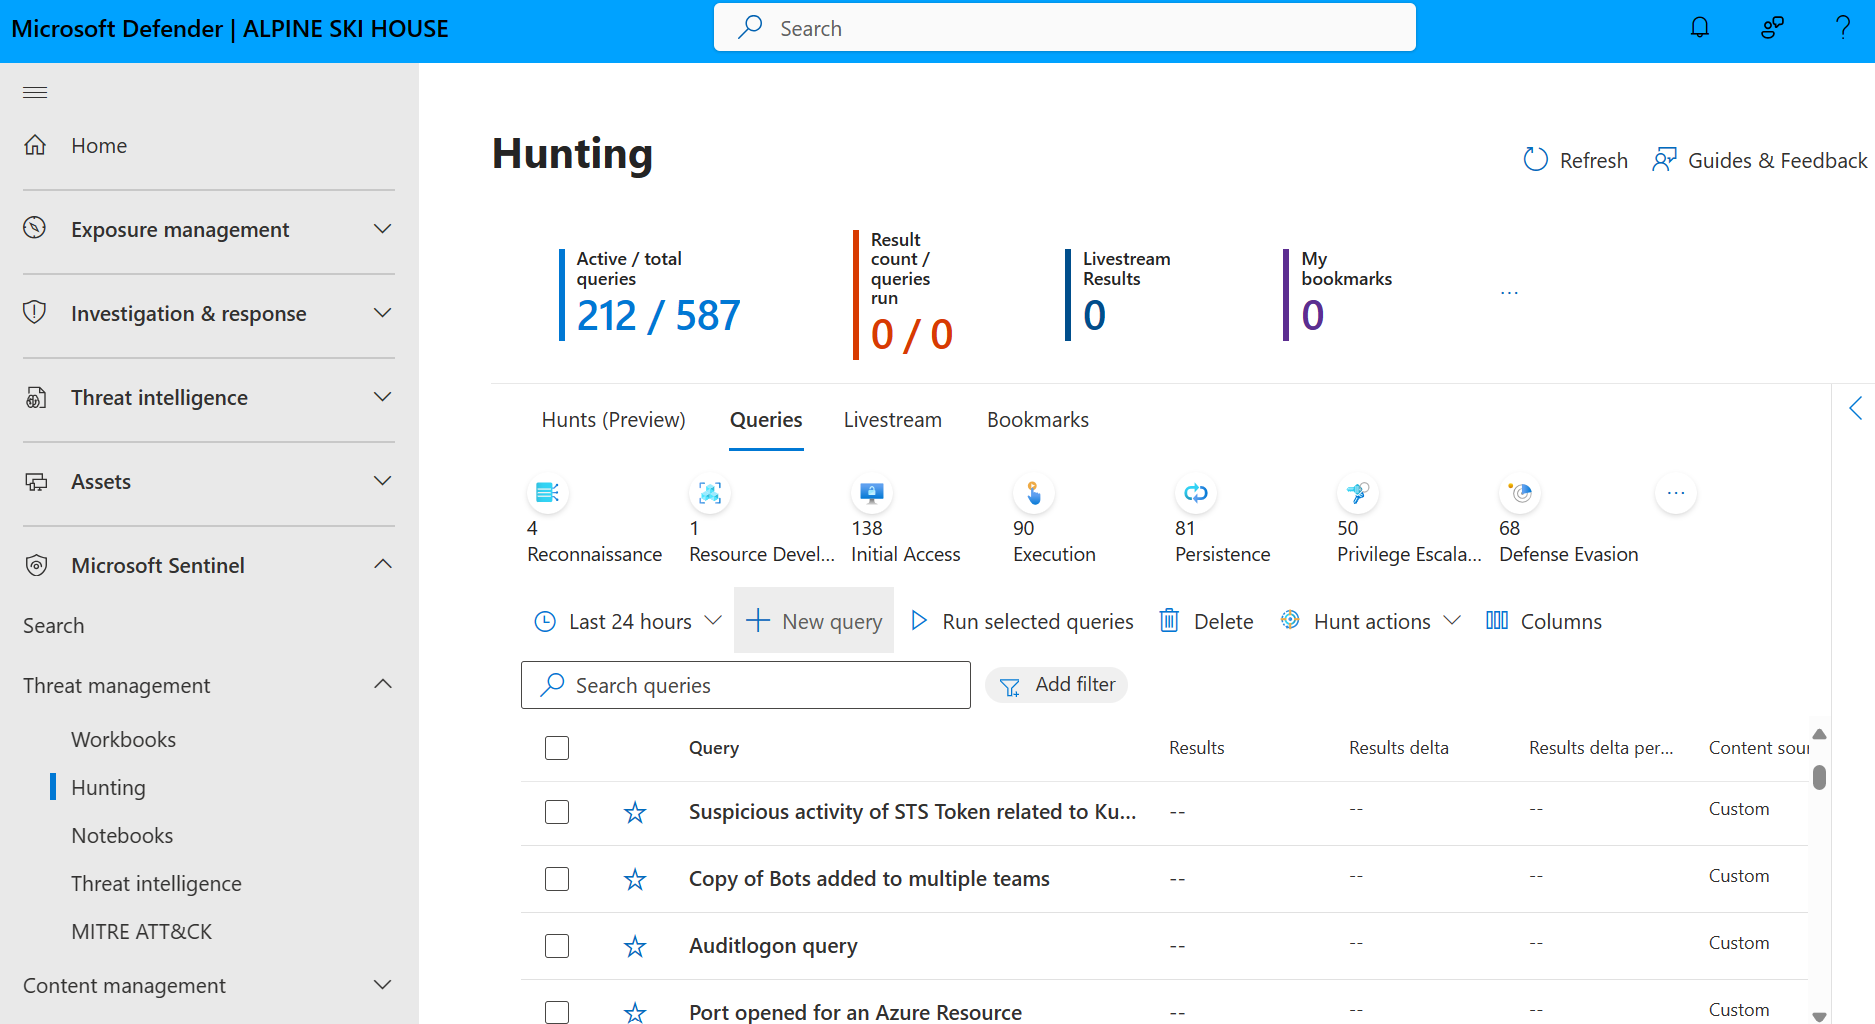
Hunts in Microsoft Sentinel (preview)
With hunts in Microsoft Sentinel, seek out undetected threats and malicious behaviors by creating a hypothesis, searching through data, validating that hypothesis, and acting when needed. Create new analytic rules, threat intelligence, and incidents based on your findings.
| Capabilities | Description |
|---|---|
| Define a hypothesis | To define a hypothesis, find inspiration from the MITRE map, recent hunting query results, content hub solutions, or generate your own custom hunts. |
| Investigate queries and bookmark results | After you define a hypothesis, go to the Hunting page Queries tab. Select the queries related to your hypothesis and New hunt to get started. Run hunt related queries and investigate the results using the logs experience. Bookmark results directly to your hunt to annotate your findings, extract entity identifiers, and preserve relevant queries. |
| Investigate and take action | Investigate even deeper by using UEBA entity pages. Run entity specific playbooks on bookmarked entities. Use built-in actions to create new analytic rules, threat indicators, and incidents based on findings. |
| Track your results | Record the results of your hunt. Track if your hypothesis is validated or not. Leave detailed notes in the comments. Hunts automatically links new analytic rules and incidents. Track the overall impact of your hunting program with the metric bar. |
To get started, see Conduct end-to-end proactive threat hunting in Microsoft Sentinel.
Hunting queries
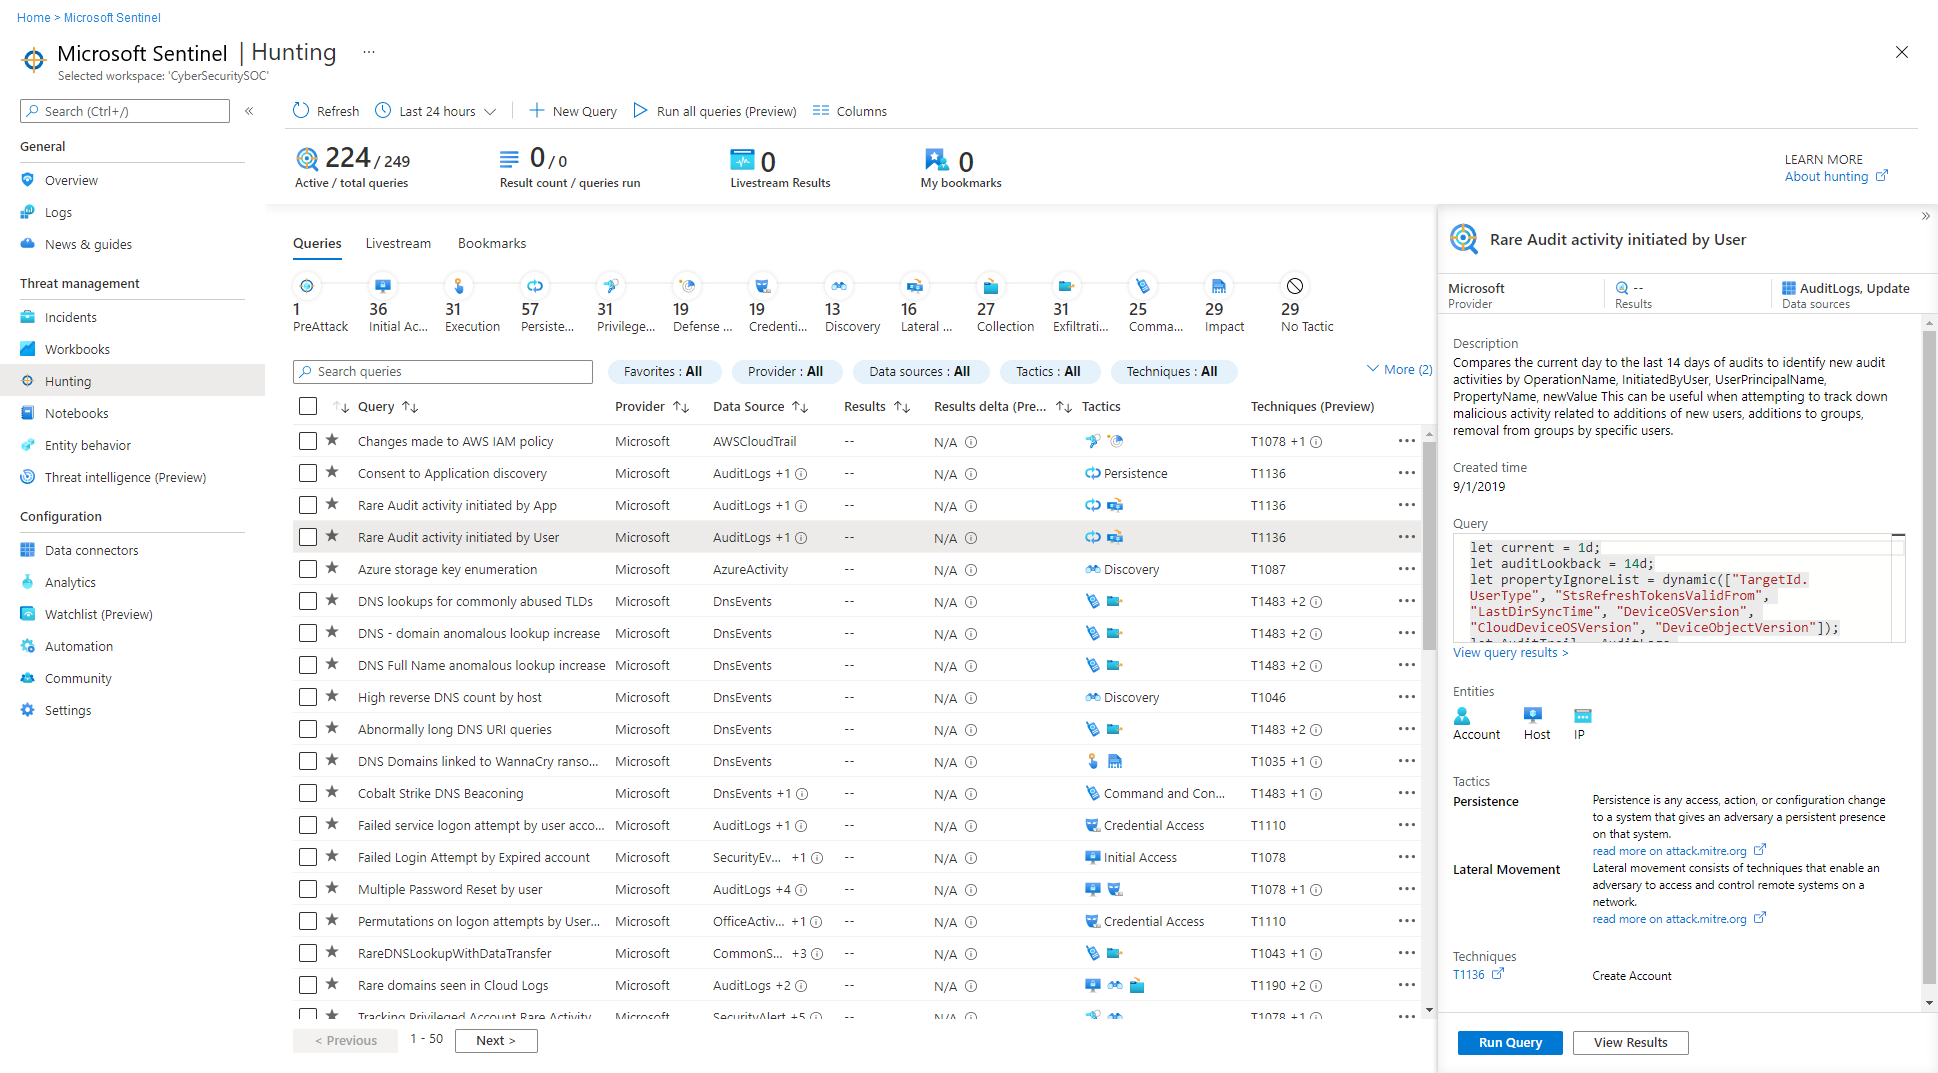
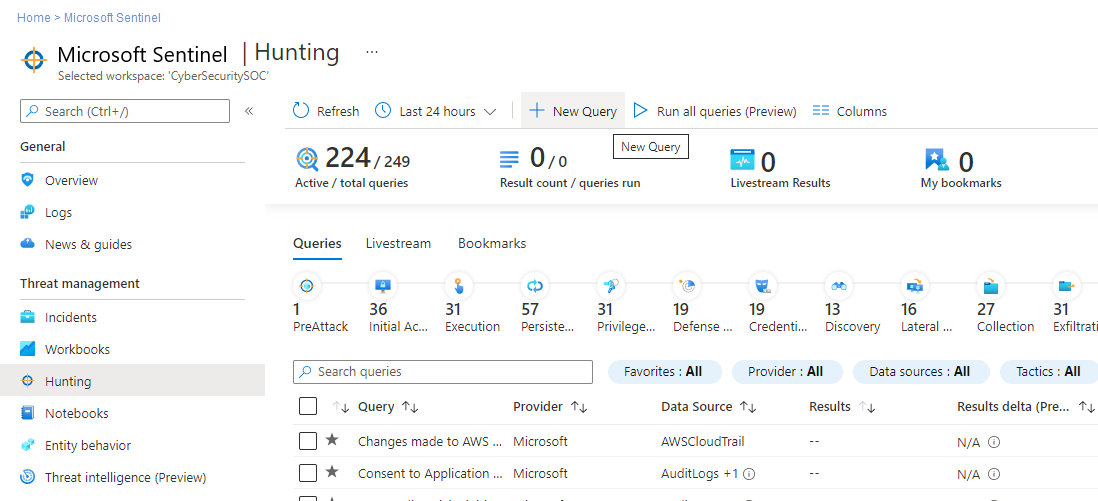
In Microsoft Sentinel, select Hunting > Queries tab to run all your queries, or a selected subset. The Queries tab lists all the hunting queries installed with security solutions from the Content hub, and any extra query you created or modified. Each query provides a description of what it hunts for, and what kind of data it runs on. These queries are grouped by their MITRE ATT&CK tactics. The icons on the right categorize the type of threat, such as initial access, persistence, and exfiltration. MITRE ATT&CK techniques are shown in the Techniques column and describe the specific behavior identified by the hunting query.
Use the queries tab to identify where to start hunting, by looking at result count, spikes, or the change in result count over a 24-hour period. Sort and filter by favorites, data source, MITRE ATT&CK tactic or technique, results, results delta, or results delta percentage. View queries that still need data sources connected, and get recommendations on how to enable these queries.
The following table describes detailed actions available from the hunting dashboard:
| Action | Description |
|---|---|
| See how queries apply to your environment | Select the Run all queries button, or select a subset of queries using the check boxes to the left of each row and select the Run selected queries button. Running your queries can take anywhere from a few seconds to many minutes, depending on how many queries are selected, the time range, and the amount of data that is being queried. |
| View the queries that returned results | After your queries are done running, view the queries that returned results using the Results filter: - Sort to see which queries had the most or fewest results. - View the queries that aren't at all active in your environment by selecting N/A in the Results filter. - Hover over the info icon (i) next to the N/A to see which data sources are required to make this query active. |
| Identify spikes in your data | Identify spikes in the data by sorting or filtering on Results delta or Results delta percentage. Compares the results of the last 24 hours against the results of the previous 24-48 hours, highlighting any large differences or relative difference in volume. |
| View queries mapped to the MITRE ATT&CK tactic | The MITRE ATT&CK tactic bar, at the top of the table, lists how many queries are mapped to each MITRE ATT&CK tactic. The tactic bar gets dynamically updated based on the current set of filters applied. Enables you to see which MITRE ATT&CK tactics show up when you filter by a given result count, a high result delta, N/A results, or any other set of filters. |
| View queries mapped to MITRE ATT&CK techniques | Queries can also be mapped to MITRE ATT&CK techniques. You can filter or sort by MITRE ATT&CK techniques using the Technique filter. By opening a query, you're able to select the technique to see the MITRE ATT&CK description of the technique. |
| Save a query to your favorites | Queries saved to your favorites automatically run each time the Hunting page is accessed. You can create your own hunting query or clone and customize an existing hunting query template. |
| Run queries | Select Run Query in the hunting query details page to run the query directly from the hunting page. The number of matches is displayed within the table, in the Results column. Review the list of hunting queries and their matches. |
| Review an underlying query | Perform a quick review of the underlying query in the query details pane. You can see the results by clicking the View query results link (below the query window) or the View Results button (at the bottom of the pane). The query opens the Logs (Log Analytics) page, and below the query, you can review the matches for the query. |
Use queries before, during, and after a compromise to take the following actions:
Before an incident occurs: Waiting on detections isn't enough. Take proactive action by running any threat-hunting queries related to the data you're ingesting into your workspace at least once a week.
Results from your proactive hunting provide early insight into events that might confirm that a compromise is in process, or at least show weaker areas in your environment that are at risk and need attention.
During a compromise: Use livestream to run a specific query constantly, presenting results as they come in. Use livestream when you need to actively monitor user events, such as if you need to verify whether a specific compromise is still taking place, to help determine a threat actor's next action, and towards the end of an investigation to confirm that the compromise is indeed over.
After a compromise: After a compromise or an incident occurred, make sure to improve your coverage and insight to prevent similar incidents in the future.
Modify your existing queries or create new ones to assist with early detection, based on insights gained from your compromise or incident.
If you discovered or created a hunting query that provides high value insights into possible attacks, create custom detection rules based on that query and surface those insights as alerts to your security incident responders.
View the query's results, and select New alert rule > Create Microsoft Sentinel alert. Use the Analytics rule wizard to create a new rule based on your query. For more information, see Create custom analytics rules to detect threats.
You can also create hunting and livestream queries over data stored in Azure Data Explorer. For more information, see details of constructing cross-resource queries in the Azure Monitor documentation.
To find more queries and data sources, go to the Content hub in Microsoft Sentinel or refer to community resources like Microsoft Sentinel GitHub repository.
Out of the box hunting queries
Many security solutions include out of the box hunting queries. After you install a solution that includes hunting queries from the Content hub, the out of the box queries for that solution show on the hunting Queries tab. Queries run on data stored in log tables, such as for process creation, DNS events, or other event types.
Many available hunting queries are developed by Microsoft security researchers on a continuous basis. They add new queries to security solutions and fine-tune existing queries to provide you with an entry point to look for new detections and attacks.
Custom hunting queries
Create or edit a query and save it as your own query or share it with users who are in the same tenant. In Microsoft Sentinel, create a custom hunting query from the Hunting > Queries tab.
For more information, see Create custom hunting queries in Microsoft Sentinel.
Livestream sessions
Create interactive sessions that let you test newly created queries as events occur, get notifications from the sessions when a match is found, and launch investigations if necessary. You can quickly create a livestream session using any Log Analytics query.
Test newly created queries as events occur
You can test and adjust queries without any conflicts to current rules that are being actively applied to events. After you confirm these new queries work as expected, it's easy to promote them to custom alert rules by selecting an option that elevates the session to an alert.
Get notified when threats occur
You can compare threat data feeds to aggregated log data and be notified when a match occurs. Threat data feeds are ongoing streams of data that are related to potential or current threats, so the notification might indicate a potential threat to your organization. Create a livestream session instead of a custom alert rule to be notified of a potential issue without the overheads of maintaining a custom alert rule.
Launch investigations
If there's an active investigation that involves an asset such as a host or user, view specific (or any) activity in the log data as it occurs on that asset. Be notified when that activity occurs.
For more information, see Detect threats by using hunting livestream in Microsoft Sentinel.
Bookmarks to keep track of data
Threat hunting typically requires reviewing mountains of log data looking for evidence of malicious behavior. During this process, investigators find events that they want to remember, revisit, and analyze as part of validating potential hypotheses and understanding the full story of a compromise.
During the hunting and investigation process, you might come across query results that look unusual or suspicious. Bookmark these items to refer back to them in the future, such as when creating or enriching an incident for investigation. Events such as potential root causes, indicators of compromise, or other notable events should be raised as a bookmark. If a key event you bookmarked is severe enough to warrant an investigation, escalate it to an incident.
In your results, mark the checkboxes for any rows you want to preserve, and select Add bookmark. This creates for a record for each marked row, a bookmark, that contains the row results and the query that created the results. You can add your own tags and notes to each bookmark.
- As with scheduled analytics rules, you can enrich your bookmarks with entity mappings to extract multiple entity types and identifiers, and MITRE ATT&CK mappings to associate particular tactics and techniques.
- Bookmarks default to use the same entity and MITRE ATT&CK technique mappings as the hunting query that produced the bookmarked results.
View all the bookmarked findings by clicking on the Bookmarks tab in the main Hunting page. Add tags to bookmarks to classify them for filtering. For example, if you're investigating an attack campaign, you can create a tag for the campaign, apply the tag to any relevant bookmarks, and then filter all the bookmarks based on the campaign.
Investigate a single bookmarked finding by selecting the bookmark and then clicking Investigate in the details pane to open the investigation experience. View, investigate, and visually communicate your findings by using an interactive entity-graph diagram and timeline. You can also directly select a listed entity to view that entity’s corresponding entity page.
You can also create an incident from one or more bookmarks, or add one or more bookmarks to an existing incident. Select a checkbox to the left of any bookmarks you want to use, and then select Incident actions > Create new incident or Add to existing incident. Triage and investigate the incident like any other.
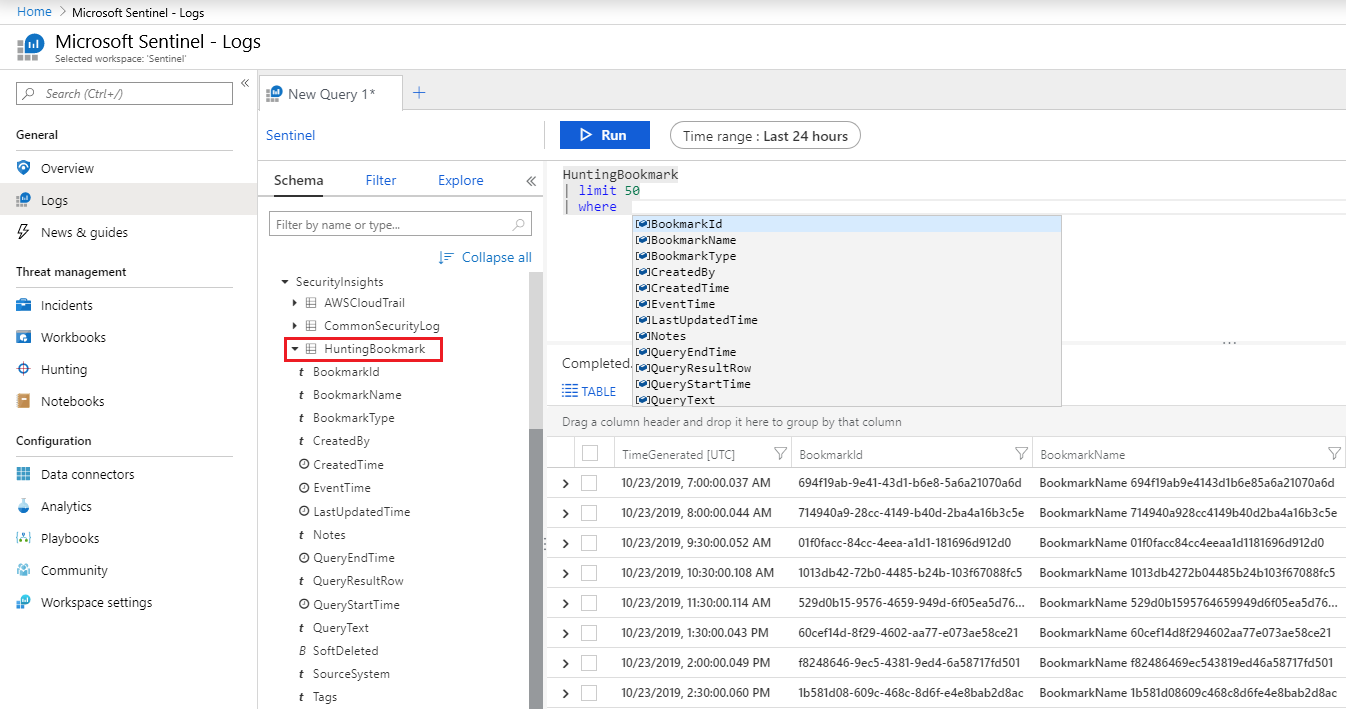
View your bookmarked data directly in the HuntingBookmark table in your Log Analytics workspace. For example:
Viewing bookmarks from the table enables you to filter, summarize, and join bookmarked data with other data sources, making it easy to look for corroborating evidence.
To start using bookmarks, see Keep track of data during hunting with Microsoft Sentinel.
Notebooks to power investigations
When your hunting and investigations become more complex, use Microsoft Sentinel notebooks to enhance your activity with machine learning, visualizations, and data analysis.
Notebooks provide a kind of virtual sandbox, complete with its own kernel, where you can carry out a complete investigation. Your notebook can include the raw data, the code you run on that data, the results, and their visualizations. Save your notebooks so that you can share it with others to reuse in your organization.
Notebooks might be helpful when your hunting or investigation becomes too large to remember easily, view details, or when you need to save queries and results. To help you create and share notebooks, Microsoft Sentinel provides Jupyter Notebooks, an open-source, interactive development, and data manipulation environment, integrated directly in the Microsoft Sentinel Notebooks page.
For more information, see:
- Use Jupyter Notebook to hunt for security threats
- The Jupyter Project documentation
- Jupyter introductory documentation.
- The Infosec Jupyter Book
- Real Python tutorials
The following table describes some methods of using Jupyter notebooks to help your processes in Microsoft Sentinel:
| Method | Description |
|---|---|
| Data persistence, repeatability, and backtracking | If you're working with many queries and results sets, you're likely to have some dead ends. You need to decide which queries and results to keep, and how to accumulate the useful results in a single report. Use Jupyter Notebooks to save queries and data as you go, use variables to rerun queries with different values or dates, or save your queries to rerun on future investigations. |
| Scripting and programming | Use Jupyter Notebooks to add programming to your queries, including: - Declarative languages like Kusto Query Language (KQL) or SQL, to encode your logic in a single, possibly complex, statement. - Procedural programming languages, to run logic in a series of steps. Split your logic into steps to help you see and debug intermediate results, add functionality that might not be available in the query language, and reuse partial results in later processing steps. |
| Links to external data | While Microsoft Sentinel tables have most telemetry and event data, Jupyter Notebooks can link to any data that's accessible over your network or from a file. Using Jupyter Notebooks allows you to include data such as: - Data in external services that you don't own, such as geolocation data or threat intelligence sources - Sensitive data that's stored only within your organization, such as human resource databases or lists of high-value assets - Data that you haven't yet migrated to the cloud. |
| Specialized data processing, machine learning, and visualization tools | Jupyter Notebooks provides more visualizations, machine learning libraries, and data processing and transformation features. For example, use Jupyter Notebooks with the following Python capabilities: - pandas for data processing, cleanup, and engineering - Matplotlib, HoloViews, and Plotly for visualization - NumPy and SciPy for advanced numerical and scientific processing - scikit-learn for machine learning - TensorFlow, PyTorch, and Keras for deep learning Tip: Jupyter Notebooks supports multiple language kernels. Use magics to mix languages within the same notebook, by allowing the execution of individual cells using another language. For example, you can retrieve data using a PowerShell script cell, process the data in Python, and use JavaScript to render a visualization. |
MSTIC, Jupyter, and Python security tools
The Microsoft Threat Intelligence Center (MSTIC) is a team of Microsoft security analysts and engineers who author security detections for several Microsoft platforms and work on threat identification and investigation.
MSTIC built MSTICPy, a library for information security investigations and hunting in Jupyter Notebooks. MSTICPy provides reusable functionality that aims to speed up notebook creation, and make it easier for users to read notebooks in Microsoft Sentinel.
For example, MSTICPy can:
- Query log data from multiple sources.
- Enrich the data with threat intelligence, geolocations, and Azure resource data.
- Extract Indicators of Activity (IoA) from logs, and unpack encoded data.
- Do sophisticated analyses such as anomalous session detection and time series decomposition.
- Visualize data using interactive timelines, process trees, and multi-dimensional Morph Charts.
MSTICPy also includes some time-saving notebook tools, such as widgets that set query time boundaries, select and display items from lists, and configure the notebook environment.
For more information, see:
- MSTICPy documentation
- Jupyter notebooks with Microsoft Sentinel hunting capabilities
- Advanced configurations for Jupyter notebooks and MSTICPy in Microsoft Sentinel
Useful operators and functions
Hunting queries are built in Kusto Query Language (KQL), a powerful query language with IntelliSense language that gives you the power and flexibility you need to take hunting to the next level.
It's the same language used by the queries in your analytics rules and elsewhere in Microsoft Sentinel. For more information, see Query Language Reference.
The following operators are especially helpful in Microsoft Sentinel hunting queries:
where - Filter a table to the subset of rows that satisfy a predicate.
summarize - Produce a table that aggregates the content of the input table.
join - Merge the rows of two tables to form a new table by matching values of the specified columns from each table.
count - Return the number of records in the input record set.
top - Return the first N records sorted by the specified columns.
limit - Return up to the specified number of rows.
project - Select the columns to include, rename or drop, and insert new computed columns.
extend - Create calculated columns and append them to the result set.
makeset - Return a dynamic (JSON) array of the set of distinct values that Expr takes in the group
find - Find rows that match a predicate across a set of tables.
adx() - This function performs cross-resource queries of Azure Data Explorer data sources from the Microsoft Sentinel hunting experience and Log Analytics. For more information, see Cross-resource query Azure Data Explorer by using Azure Monitor.
Related articles
- Jupyter notebooks with Microsoft Sentinel hunting capabilities
- Keep track of data during hunting with Microsoft Sentinel
- Detect threats by using hunting livestream in Microsoft Sentinel
- Learn from an example of using custom analytics rules when monitoring Zoom with a custom connector.


