Access query history for Delta Live Tables pipelines
This article explains how to access query histories and query profiles associated with Delta Live Tables pipeline runs. You can use this information to debug queries, identify performance bottlenecks, and optimize pipeline runs.
Important
This feature is in Public Preview. Workspace admins can enable this feature from the Previews page. See Manage Azure Databricks Previews.
Requirements
- Your pipeline must be set to run in triggered mode.
Review query history for pipeline updates
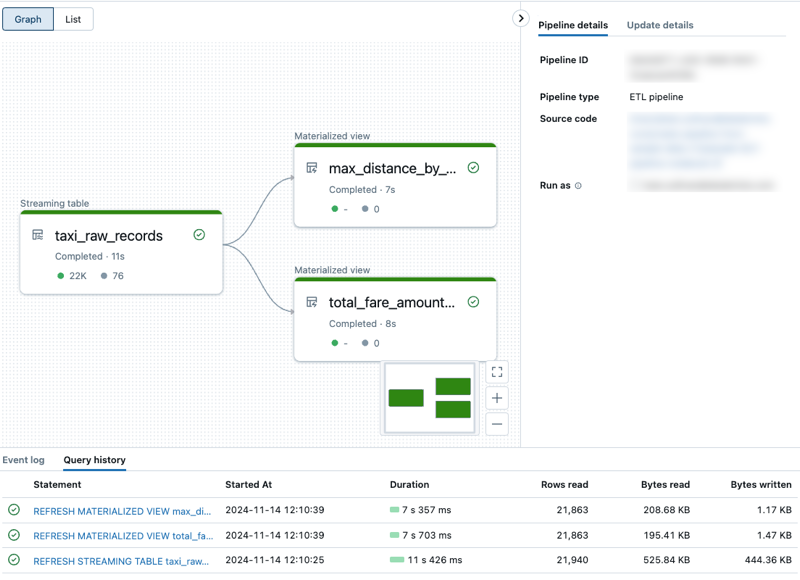
For all pipelines that meet the requirements, a query statement appears in the query history when the materialized views and streaming tables are updated. There is one REFRESH statement for every flow execution that updates a target table. You can use the Compute filter on the query history page to show only queries processed using Delta Live Tables compute. See Query history to learn more about the query history UI.
To access query details, follow these steps:
- Click
 Query History in the sidebar.
 - Select the DLT checkbox from the Compute drop-down filter.
- click a query statement to view summary details like the duration of the query and aggregated metrics.
- Click See query profile to open the query profile. See Query profile for details about the query profile.
- Optionally, use the links in the Query Source section to open the related pipeline.
Access query history from a notebook
To view query history from inside a notebook attached to a Delta Live Tables pipeline, use the following steps:
- Open the notebook. If the notebook is attached to a Delta Live Tables pipeline, an interface for inspecting the pipeline appears at the bottom of the notebook. See Develop and debug Delta Live Tables pipelines in notebooks.
- Click the DLT query history tab.
- Click the name of a query to view query details, such as duration, query source, and other aggregated metrics. To learn more about the details available in this view, see View query details.
Access query history from the Delta Live Tables pipeline UI
From the Pipeline Details page in the Delta Live Tables UI, click the Query history tab near the bottom of the screen to access the history for your pipeline. You can view the query details panel and profile by clicking on a statement.

Limitations
- Provisioning and queued time is not available.
- Metrics shown in the query details panel are updated live during flow execution, but the query profile is updated only after the flow execution finishes.