SMS Insights Dashboard
In this document, we outline the available insights dashboard to monitor SMS logs and metrics.
Overview
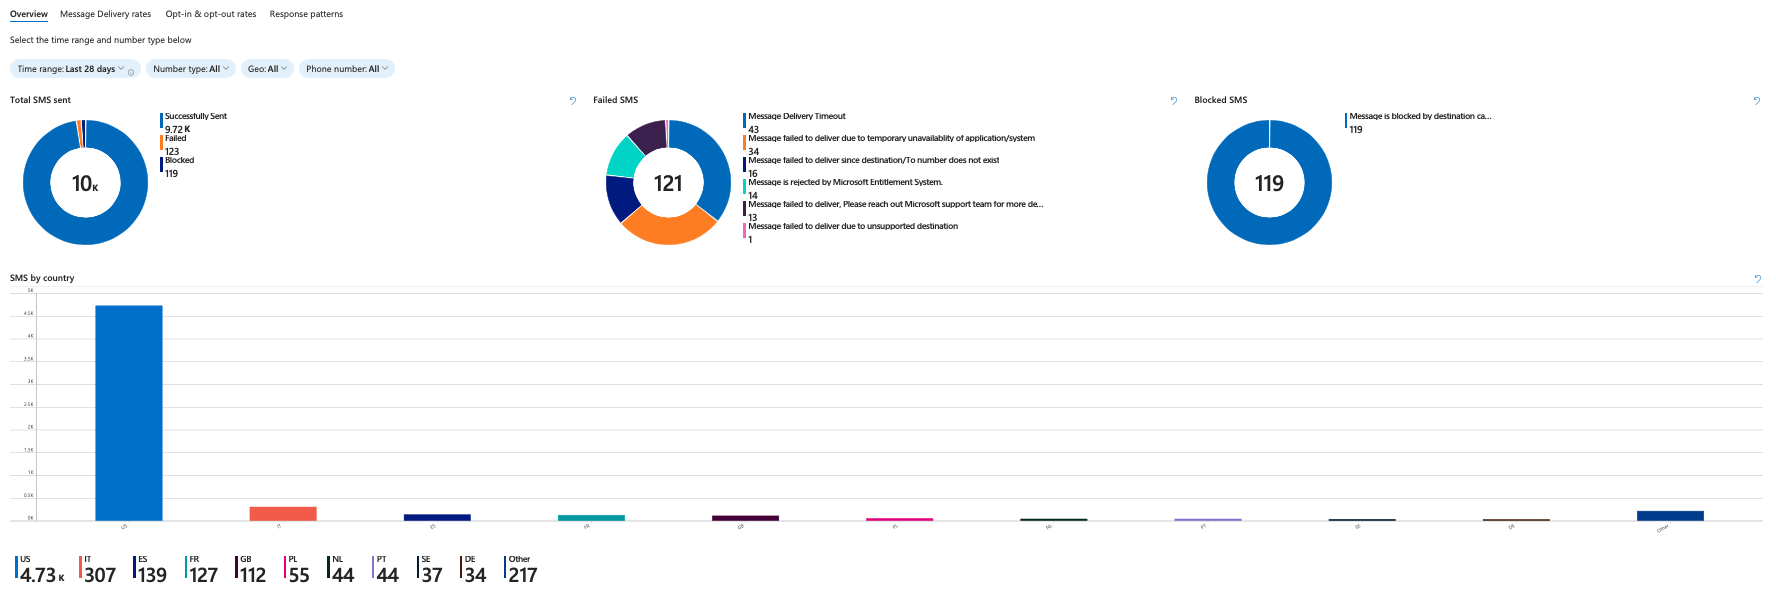
The SMS Insights dashboard in your communication resource shows data visualizations based on the logs and metrics for your SMS usage. It's powered by Azure Monitor logs and metrics that are collected and stored. Azure Monitor Workbooks are used to create the data visualization. To enable Azure Monitor collection to populate the SMS Insights dashboard see Enable Azure Monitor in Diagnostic Settings. Ensure that logs are sent to a Log Analytics workspace.
Prerequisites
- In order to take advantage of Workbooks, follow the instructions outlined in Enable Azure Monitor in Diagnostic Settings. You need to enable
SMS Operational Logs - To use Workbooks, you need to send your logs to a Log Analytics workspace destination.
Accessing Azure Insights for Communication Services
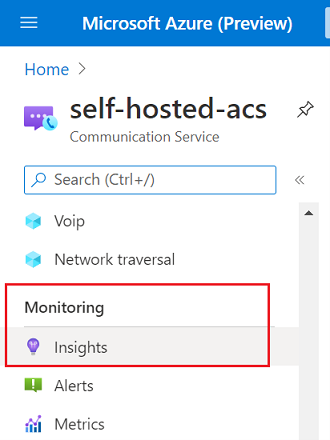
Inside your Azure Communication Services resource, scroll down on the left nav bar to the Monitor category and click on the Insights tab:
Dashboard structure
The SMS Insights Dashboard is made out of four sections:

Overview section
The Overview section provides an overall performance of sent messages along with SMS failure breakdown. The user can filter the SMS performance data by time specific time range, number type, sender number, and destination. The data is presented in interactive graphs that the user can click on to further drill down into logs.
Great to help answer general questions like:
- How many SMS have I sent through my resource?
- Are my messages being blocked or failing at a glance?
- What is my message distribution by country/region?
Top metrics

SMS by country/region

Message delivery rates section
The Message Delivery Rates section provides insights into SMS performance and delivery rate per day. The user can select a specific date in the graph to drill into logs.
Can help answer questions like:
- Are there particular days where I'm seeing fewer deliveries?
- Are there any geographies where delivery suffers most?

Opt-in & opt-out rates
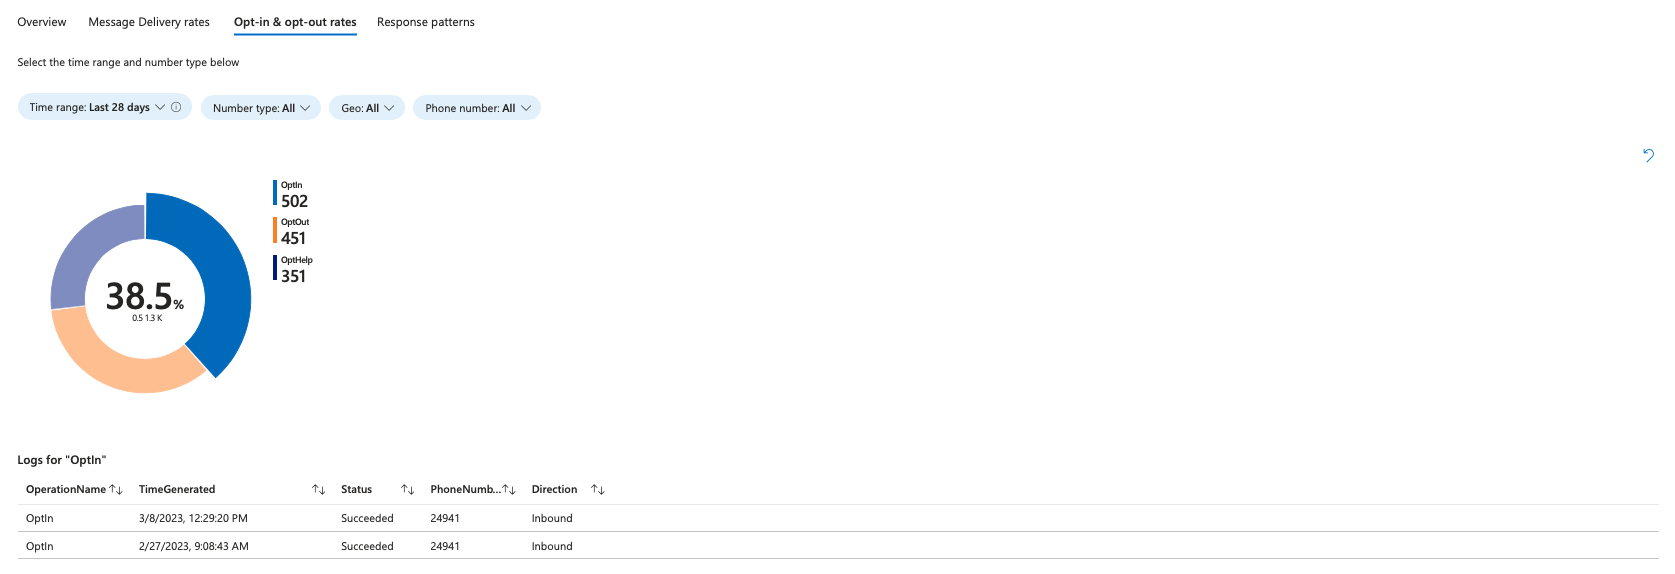
The Opt-in & opt-out rates section provides insights into end user responses for opt-ins/outs and help.
Answer questions like:
- What percentage of my users are opt-in vs opt-out?
Response patterns
The Response patterns section provides insights into the total SMS usage in a day across messages delivered, received, failed, and blocked.
This section helps you understand:
- How is my solution performing over time?

Exporting logs
The SMS logs can be exported by clicking on the Download button on the top right corner of the logs table:

Editing dashboards
The SMS insights dashboards provided with your Communication Service resource can be customized by clicking on the Edit button on the top navigation bar:
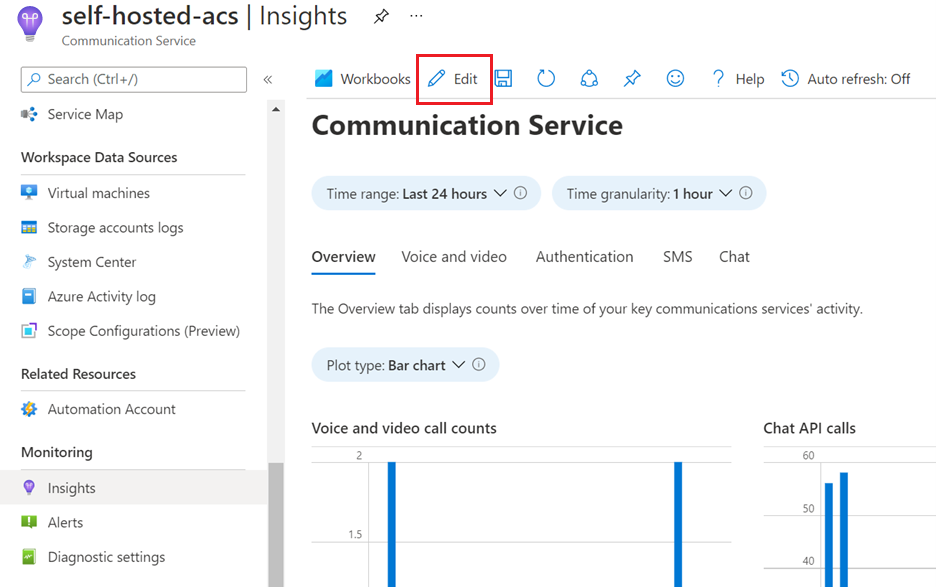
Editing these dashboards doesn't modify the Insights tab, but rather creates a separate workbook, which can be accessed on your resource’s Workbooks tab:
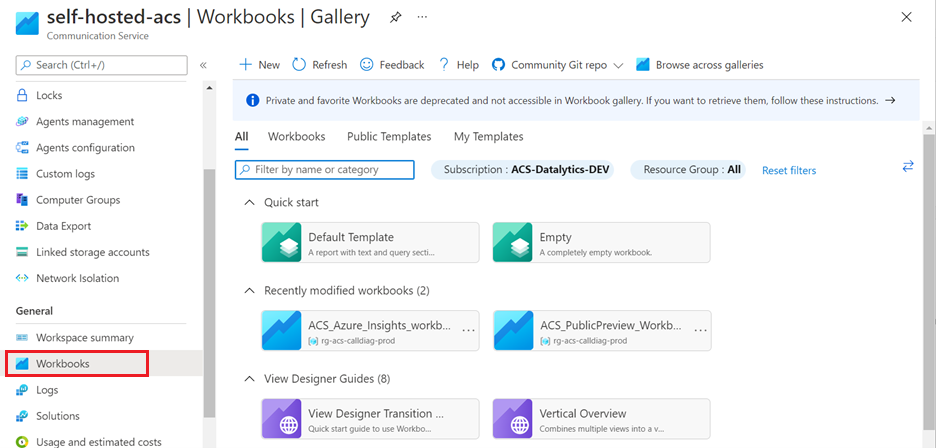
For an in-depth description of workbooks, refer to the Azure Monitor Workbooks documentation.