Enable SQL Insights (preview)
Applies to:
Azure SQL Database
Azure SQL Managed Instance
Important
SQL Insights (preview) will be retired on 31 December 2024. We recommend that you transition to database watcher for Azure SQL (preview) or another database monitoring solution by that date.
Database watcher is the recommended monitoring solution for scenarios that require low data collection latency, estate-level monitoring, comprehensive monitoring data including query-level details, and support for advanced analytics on collected monitoring data. At this time, database watcher supports Azure SQL Database and Azure SQL Managed Instance.
After 31 December 2024, SQL Insights (preview) will not be supported and will not be available in the Azure portal. You will retain any existing monitoring data collected by SQL Insights in your Log Analytics workspace.
This article describes how to enable SQL Insights (preview) to monitor your SQL deployments. Monitoring is performed from an Azure virtual machine that makes a connection to your SQL deployments and uses Dynamic Management Views (DMVs) to gather monitoring data. You can control what datasets are collected and the frequency of collection using a monitoring profile.
To enable SQL Insights (preview) by creating the monitoring profile and virtual machine using a resource manager template, see Resource Manager template samples for SQL Insights (preview).
Create Log Analytics workspace
SQL Insights stores its data in one or more Log Analytics workspaces. Before you can enable SQL Insights, you need to either create a workspace or select an existing one. A single workspace can be used with multiple monitoring profiles, but the workspace and profiles must be located in the same Azure region. To enable and access the features in SQL Insights, you must have the Log Analytics contributor role in the workspace.
Create monitoring user
You need a user (login) on the SQL deployments that you want to monitor. Follow the procedures below for different types of SQL deployments.
The instructions below cover the process per type of SQL that you can monitor. To accomplish this with a script on several SQL resources at once, please refer to the following README file and example script.
Note
SQL Insights (preview) does not support the following Azure SQL Database scenarios:
- Elastic pools: Metrics cannot be gathered for elastic pools. Metrics cannot be gathered for databases within elastic pools.
- Low service tiers: Metrics cannot be gathered for databases on Basic, S0, and S1 service objectives
SQL Insights (preview) has limited support for the following Azure SQL Database scenarios:
- Serverless tier: Metrics can be gathered for databases using the serverless compute tier. However, the process of gathering metrics will reset the auto-pause delay timer, preventing the database from entering an auto-paused state.
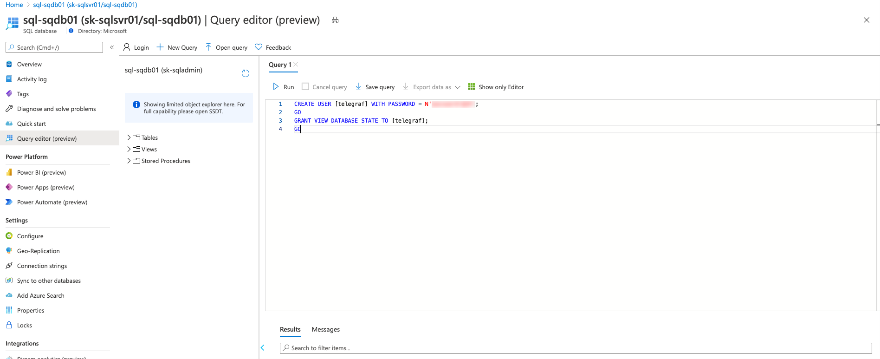
Connect to an Azure SQL database with SQL Server Management Studio, Query Editor (preview) in the Azure portal, or any other SQL client tool.
Run the following script to create a user with the required permissions. Replace user with a username and <password> with a strong password.
CREATE USER [user] WITH PASSWORD = N'<password>';
GO
GRANT VIEW DATABASE STATE TO [user];
GO
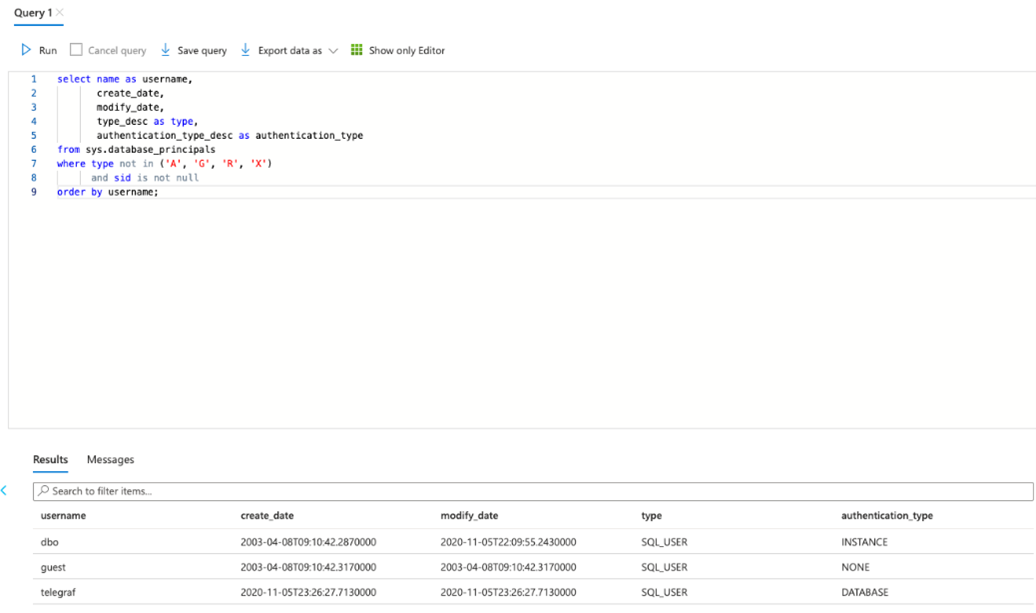
Verify the user was created.
select name as username,
       create_date,
       modify_date,
       type_desc as type,
       authentication_type_desc as authentication_type
from sys.database_principals
where type not in ('A', 'G', 'R', 'X')
       and sid is not null
order by username
Create Azure Virtual Machine
You will need to create one or more Azure virtual machines that will be used to collect data to monitor SQL.
Note
The monitoring profiles specifies what data you will collect from the different types of SQL you want to monitor. Each monitoring virtual machine can have only one monitoring profile associated with it. If you have a need for multiple monitoring profiles, then you need to create a virtual machine for each.
Azure virtual machine requirements
The Azure virtual machine has the following requirements:
- Operating system: Ubuntu 18.04 using the Azure Marketplace image. Custom images are not supported. To obtain Extended Security Maintenance (ESM) for this version of Ubuntu, we recommend using the Ubuntu Pro 18.04 LTS marketplace image. For more information, see Support for Linux and open-source technology in Azure.
- Recommended minimum Azure virtual machine sizes: Standard_B2s (2 CPUs, 4-GiB memory)
- Deployed in any Azure region supported by the Azure Monitor agent, and meeting all Azure Monitor agent prerequisites.
Note
The Standard_B2s (2 CPUs, 4 GiB memory) virtual machine size will support up to 100 connection strings. You shouldn't allocate more than 100 connections to a single virtual machine.
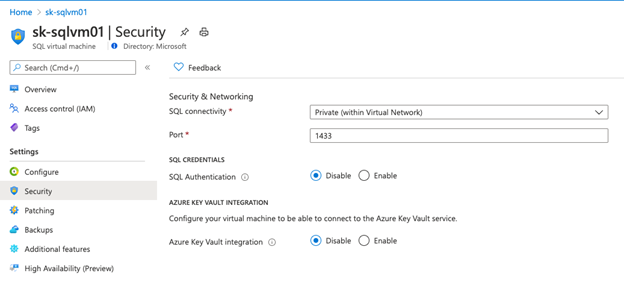
Depending upon the network settings of your SQL resources, the virtual machines may need to be placed in the same virtual network as your SQL resources so they can make network connections to collect monitoring data.
Configure network settings
Each type of SQL offers methods for your monitoring virtual machine to securely access SQL. The sections below cover the options based upon the SQL deployment type.
SQL Insights supports accessing your Azure SQL Database via its public endpoint as well as from its virtual network.
For access via the public endpoint, you would add a rule under the Firewall settings page and the IP firewall settings section in the Azure portal. For specifying access from a virtual network, you can set virtual network firewall rules and set the service tags required by the Azure Monitor agent.
Store monitoring password in Azure Key Vault
As a security best practice, we strongly recommend that you store your SQL user (login) passwords in a Key Vault, rather than entering them directly into your monitoring profile connection strings.
When settings up your profile for SQL monitoring, you will need one of the following permissions on the Key Vault resource you intend to use:
- Microsoft.Authorization/roleAssignments/write
- Microsoft.Authorization/roleAssignments/delete
If you have these permissions, a new Key Vault access policy will be automatically created as part of creating your SQL Monitoring profile that uses the Key Vault you specified.
Important
You need to ensure that network and security configuration allows the monitoring VM to access Key Vault. For more information, see Access Azure Key Vault behind a firewall and Configure Azure Key Vault networking settings.
Create SQL monitoring profile
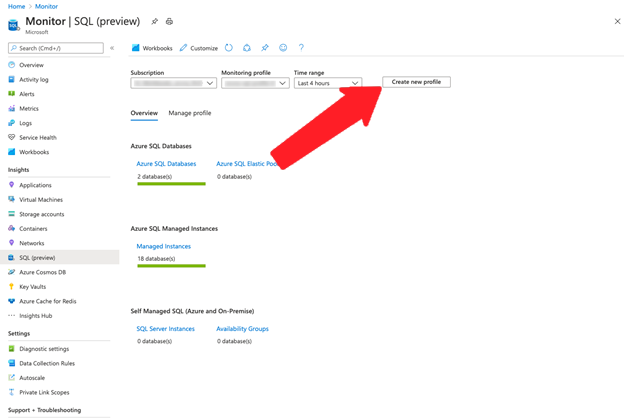
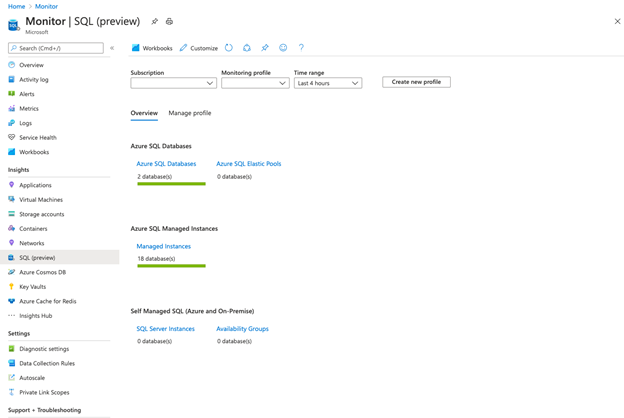
Open SQL Insights (preview) by selecting SQL (preview) from the Insights section of the Azure Monitor menu in the Azure portal. Select Create new profile.
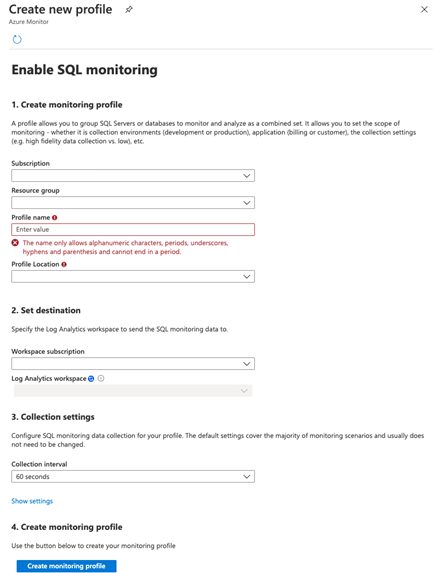
The profile will store the information that you want to collect from your SQL systems. It has specific settings for:
- Azure SQL Database
- Azure SQL Managed Instance
- SQL Server on Azure VMs
For example, you might create one profile named SQL Production and another named SQL Staging with different settings for frequency of data collection, what data to collect, and which workspace to send the data to.
The profile is stored as a data collection rule resource in the subscription and resource group you select. Each profile needs the following:
- Name. Cannot be edited once created.
- Location. This is an Azure region.
- Log Analytics workspace to store the monitoring data.
- Collection settings for the frequency and type of sql monitoring data to collect.
Note
The location of the profile should be in the same location as the Log Analytics workspace you plan to send the monitoring data to.
Select Create monitoring profile once you've entered the details for your monitoring profile. It can take up to a minute for the profile to be deployed. If you don't see the new profile listed in Monitoring profile combo box, select the refresh button and it should appear once the deployment is completed. Once you've selected the new profile, select the Manage profile tab to add a monitoring machine that will be associated with the profile.
Add monitoring machine
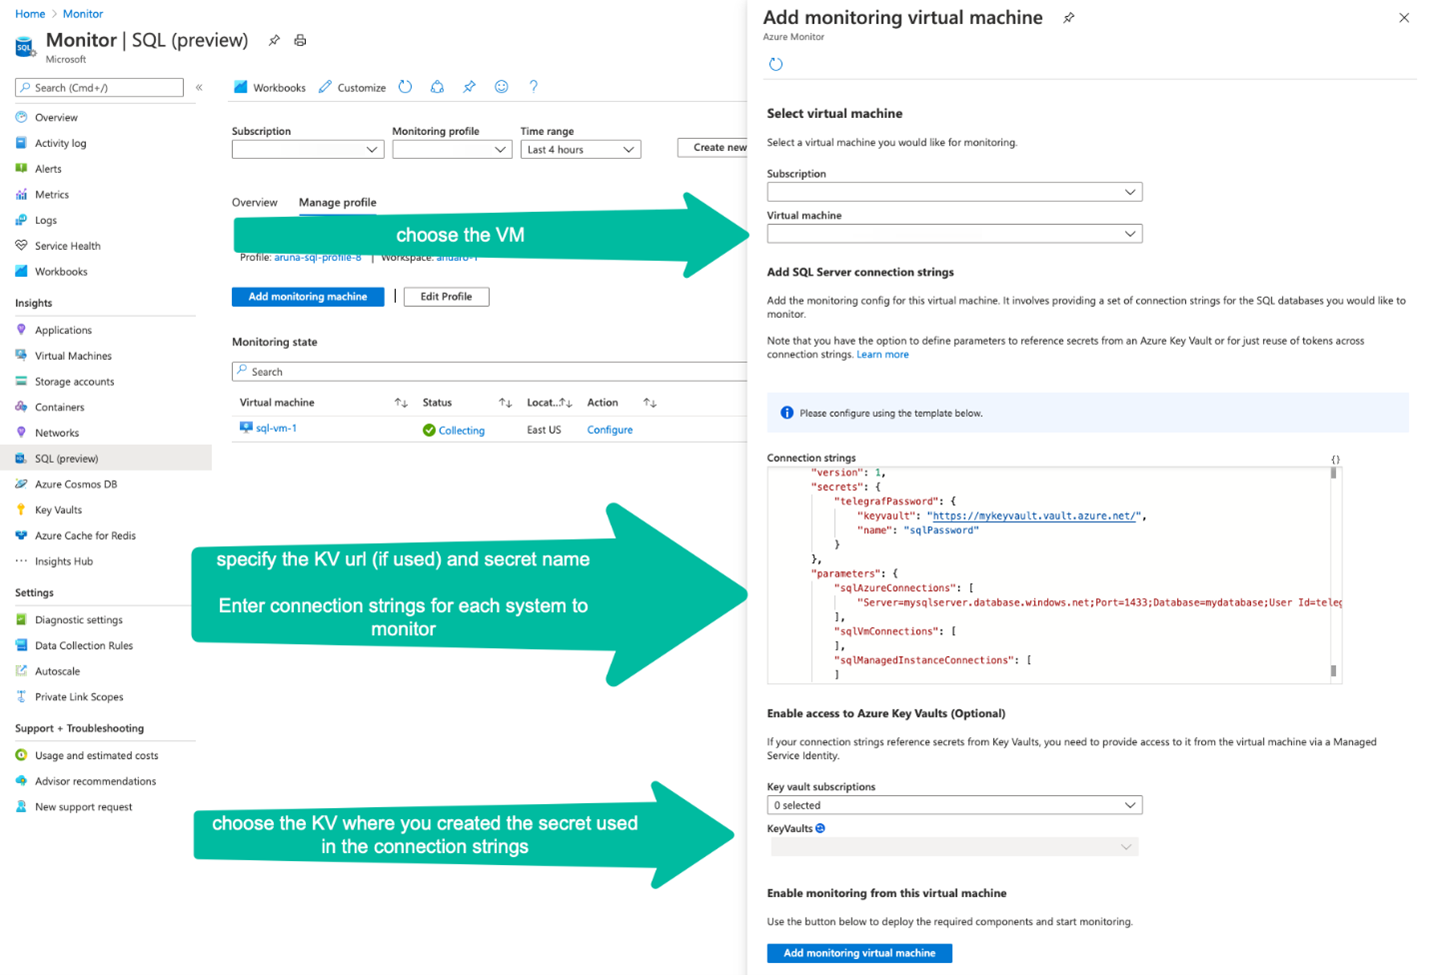
Select Add monitoring machine to open an Add monitoring virtual machine context panel to choose the virtual machine from which to monitor your SQL instances and provide the connection strings.
Select the subscription and name of your monitoring virtual machine. If you're using Key Vault to store passwords for the monitoring logins (strongly recommended), select the subscription of that Key Vault under Key vault subscriptions, and then select the Key Vault that stores secrets under KeyVault. In the Connection strings field, enter the vault URI and the secret name for each password to be used in the connection strings.
For example, if the Key Vault URI is https://mykeyvault.vault.azure.net/, and the secret names are sqlPassword1 and sqlPassword2, then the JSON in the Connection strings field will contain the following:
{
   "secrets": {
      "telegrafPassword1": {
         "keyvault": "https://mykeyvault.vault.azure.net/",
         "name": "sqlPassword1"
      },
      "telegrafPassword2": {
         "keyvault": "https://mykeyvault.vault.azure.net/",
         "name": "sqlPassword2"
      }
   }
}
You can now reference these secrets further in the Connection strings field. In the following example, the two connection strings reference the telegrafPassword1 and telegrafPassword2 secrets defined earlier:
{
   "sqlAzureConnections": [
      "Server=mysqlserver.database.windows.net;Port=1433;Database=mydatabase;User Id=telegraf;Password=$telegrafPassword1;"
   ],
   "sqlVmConnections": [
      "Server=mysqlserver1;Port=1433;Database=master;User Id=telegraf;Password=$telegrafPassword2;"
   ]
}
See the next section for details on identifying the connection string for different SQL deployments.
Add connection strings
The connection string specifies the login name that SQL Insights (preview) should use when logging into SQL to collect monitoring data. If you're using a Key Vault to store the password for your monitoring user, provide the Key Vault URI and name of the secret that contains the password.
The connections string will vary for each type of SQL resource:
TCP connections from the monitoring machine to the IP address and port used by the database must be allowed by any firewalls or network security groups (NSGs) that may exist on the network path. For details on IP addresses and ports, see Azure SQL Database connectivity architecture.
Enter the connection string in the form:
"sqlAzureConnections": [
   "Server=mysqlserver1.database.windows.net;Port=1433;Database=mydatabase;User Id=$username;Password=$password;",
   "Server=mysqlserver2.database.windows.net;Port=1433;Database=mydatabase;User Id=$username;Password=$password;"
]
Get the details from the Connection strings page and the appropriate ADO.NET endpoint for the database.
To monitor a readable secondary, append ;ApplicationIntent=ReadOnly to the connection string. SQL Insights supports monitoring a single secondary. The collected data will be tagged to reflect primary or secondary.
