Monitor virtual machines with Azure Monitor: Analyze monitoring data
This article is part of the guide Monitor virtual machines and their workloads in Azure Monitor. It describes how to analyze monitoring data for your virtual machines after completing their configuration.
Note
This scenario describes how to implement complete monitoring of your Azure and hybrid virtual machine environment. To get started monitoring your first Azure virtual machine, see Monitor Azure virtual machines or Tutorial: Collect guest logs and metrics from Azure virtual machine.
Once you configure data collection for your virtual machines, data will be available for analysis. This article describes the different features of Azure Monitor that you can use to analyze the health and performance of your virtual machines. Several of these features provide a different experience depending on whether you're analyzing a single machine or multiple. Each experience is described here with any unique behavior of each feature depending on which experience is being used.
Single machine experience
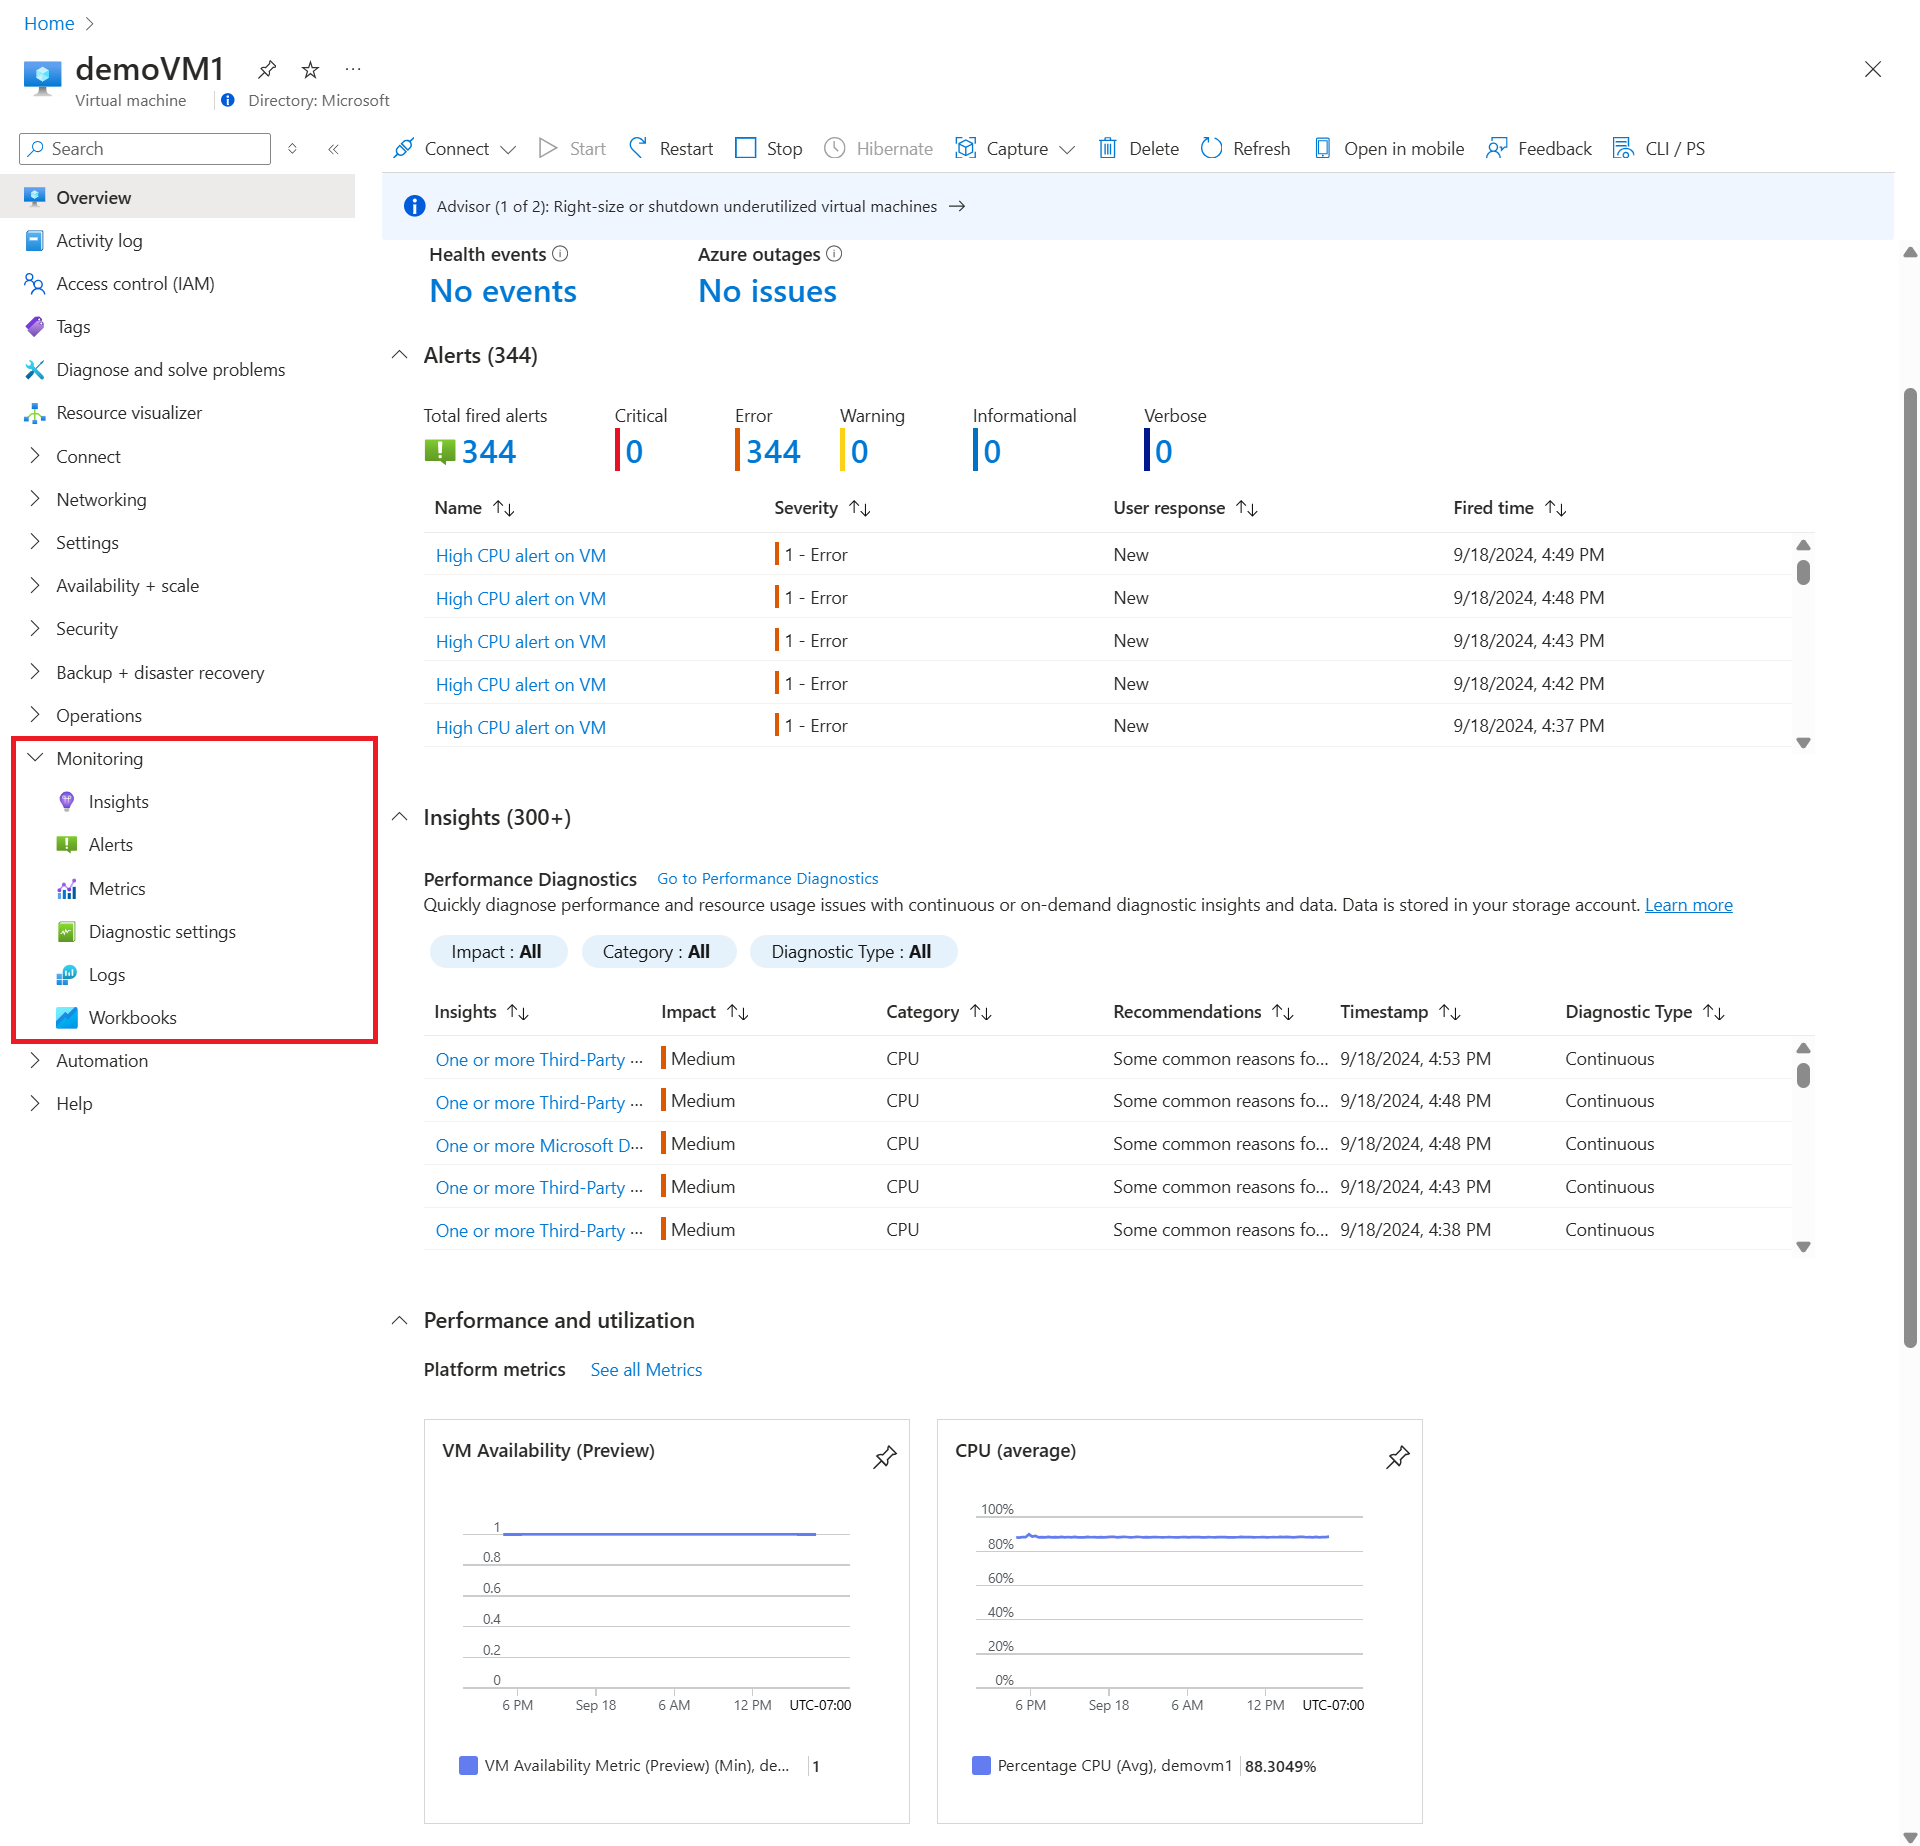
Access the single machine analysis experience from the Monitoring section of the menu in the Azure portal for each Azure virtual machine and Azure Arc-enabled server. These options either limit the data that you're viewing to that machine or at least set an initial filter for it. In this way, you can focus on a particular machine, view its current performance and its trending over time, and help to identify any issues it might be experiencing.
| Option | Description |
|---|---|
| Overview page | Select the Monitoring tab to display alerts, platform metrics, and other monitoring information for the virtual machine host. You can see the number of active alerts on the tab. In the Monitoring tab, you get a quick view of: Alerts: the alerts fired in the last 24 hours, with some important statistics about those alerts. If you don't have any alerts set up for this VM, there's a link to help you quickly create new alerts for your VM. Key metrics: the trend over different time periods for important metrics, such as CPU, network, and disk. Because these are host metrics though, counters from the guest operating system such as memory aren't included. Select a graph to work with this data in metrics explorer where you can perform different aggregations, and add more counters for analysis. |
| Activity log | See activity log entries filtered for the current virtual machine. Use this log to view the recent activity of the machine, such as any configuration changes and when it was stopped and started. |
| Insights | Displays VM insights views if the VM is enabled for VM insights. Select the Performance tab to view trends of critical performance counters over different periods of time. When you open VM insights from the virtual machine menu, you also have a table with detailed metrics for each disk. For details on how to use the Map view for a single machine, see Chart performance with VM insights. If processes and dependencies is enabled for the VM, select the Map tab to view the running processes on the machine, dependencies on other machines, and external processes. For details on how to use the Map view for a single machine, see Use the Map feature of VM insights to understand application components. If the VM isn't enabled for VM insights, it offers the option to enable VM insights. |
| Alerts | View alerts for the current virtual machine. These alerts only use the machine as the target resource, so there might be other alerts associated with it. You might need to use the Alerts option in the Azure Monitor menu to view alerts for all resources. For details, see Monitor virtual machines with Azure Monitor - Alerts. |
| Metrics | Open metrics explorer with the scope set to the machine. This option is the same as selecting one of the performance charts from the Overview page except that the metric isn't already added. |
| Diagnostic settings | Enable and configure the diagnostics extension for the current virtual machine. This option is different than the Diagnostic settings option for other Azure resources. This is a legacy agent that has been replaced by the Azure Monitor agent. |
| Advisor recommendations | See recommendations for the current virtual machine from Azure Advisor. |
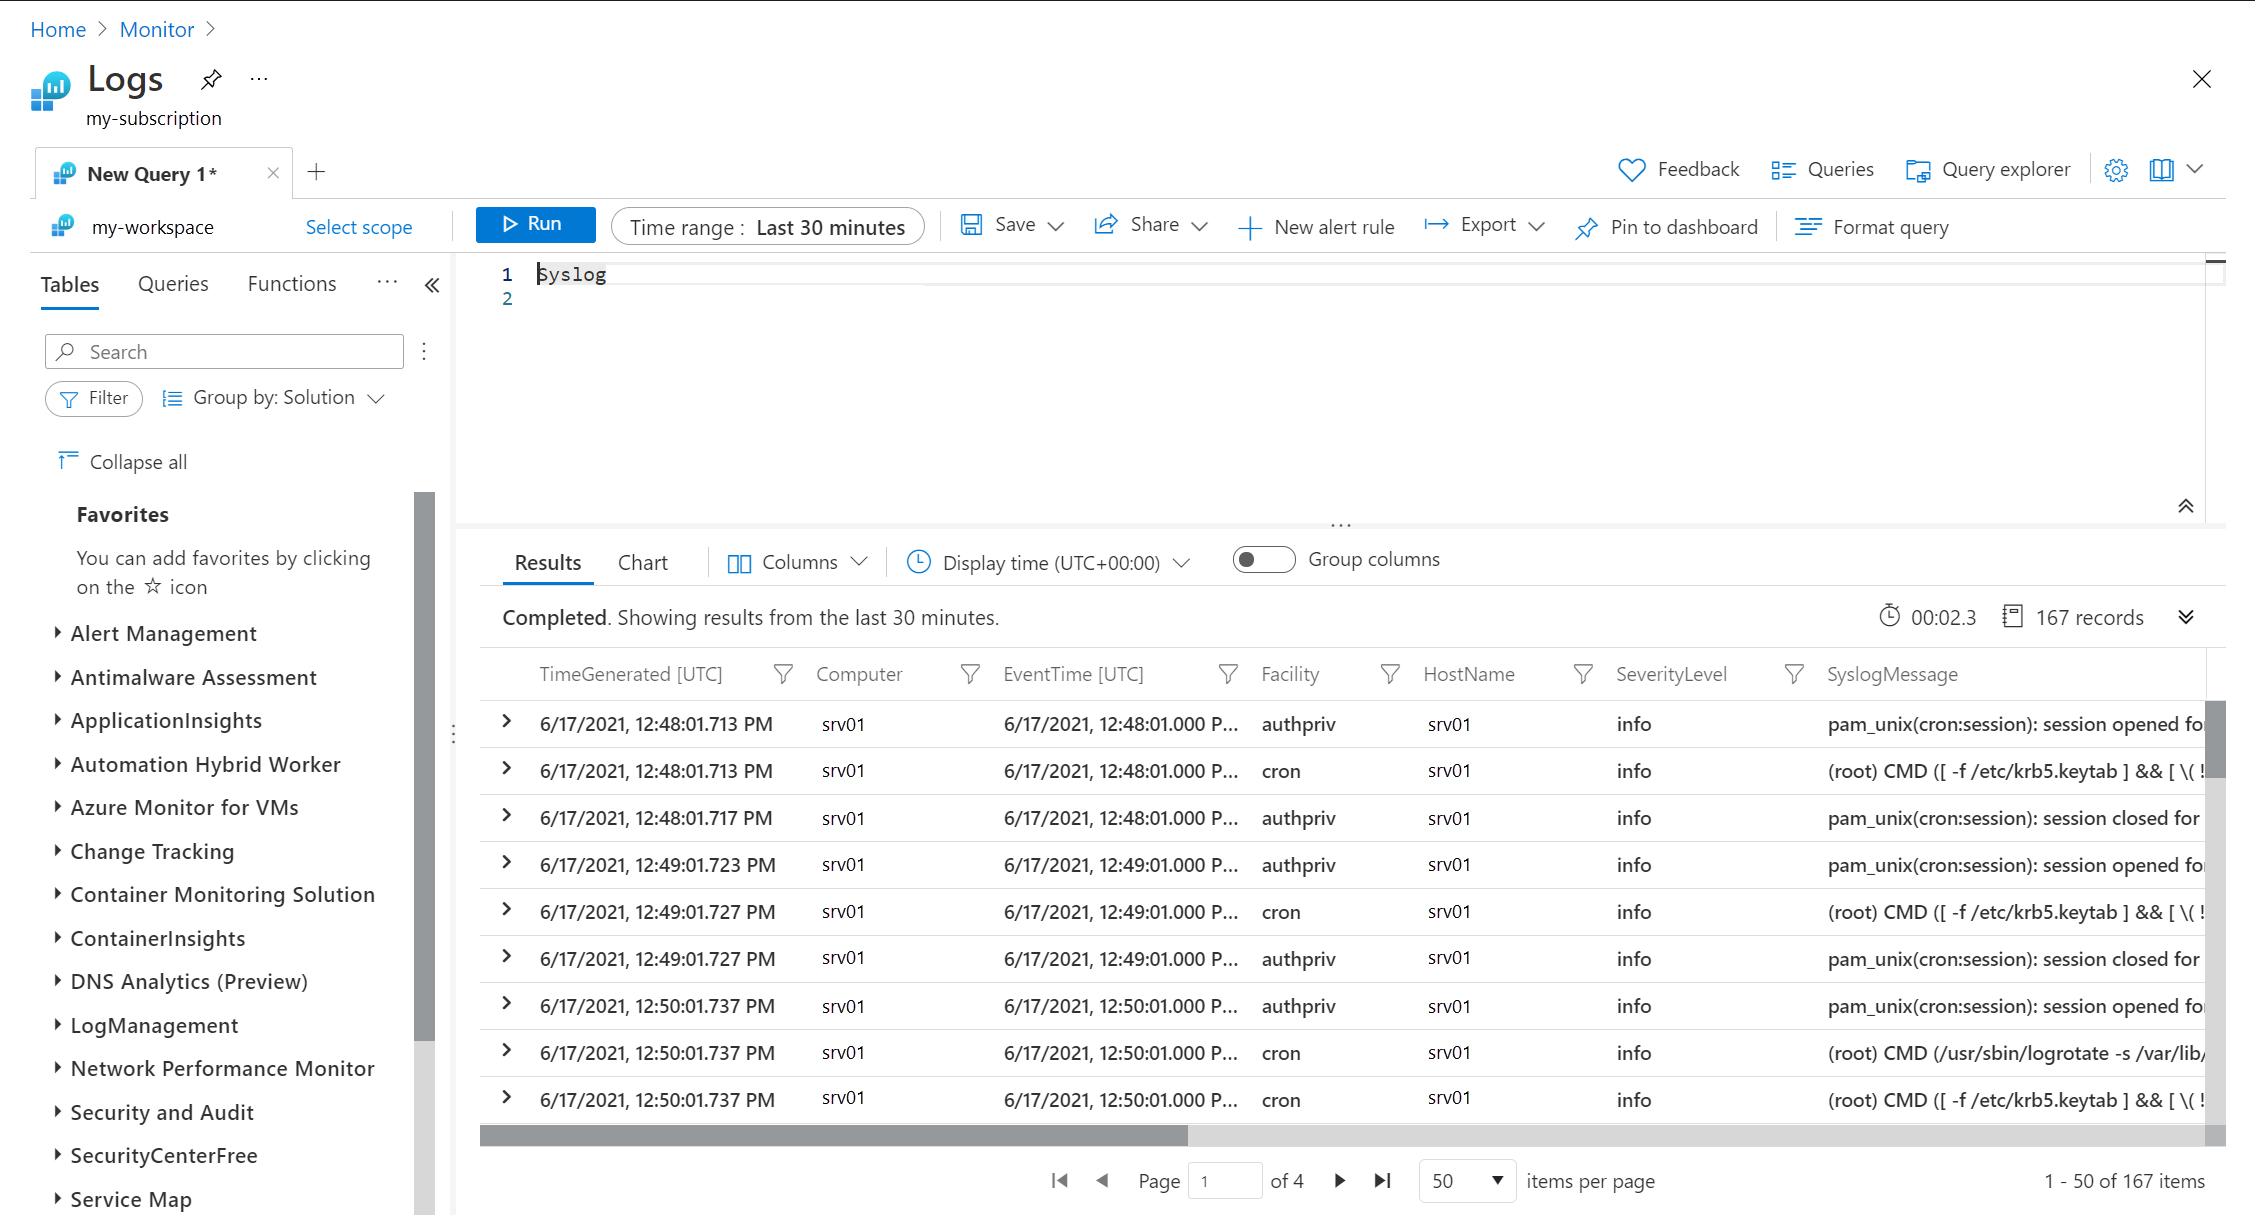
| Logs | Open Log Analytics with the scope set to the current virtual machine. You can select from various existing queries to drill into log and performance data for only this machine. |
| Connection monitor | Open Network Watcher Connection Monitor to monitor connections between the current virtual machine and other virtual machines. |
| Workbooks | Open the workbook gallery with the VM insights workbooks for single machines. For a list of the VM insights workbooks designed for individual machines, see VM insights workbooks. |
Multiple machine experience
Access the multiple machine analysis experience from the Monitor menu in the Azure portal for each Azure virtual machine and Azure Arc-enabled server. This includes only VMs that are enabled for VM insights. These options provide access to all data so that you can select the virtual machines that you're interested in comparing.
| Option | Description |
|---|---|
| Activity log | See activity log entries filtered for all resources. Create a filter for a Resource Type of virtual machines or Virtual Machine Scale Sets to view events for all your machines. |
| Alerts | View alerts for all resources. This includes alerts related to all virtual machines in the workspace. Create a filter for a Resource Type of virtual machines or Virtual Machine Scale Sets to view alerts for all your machines. |
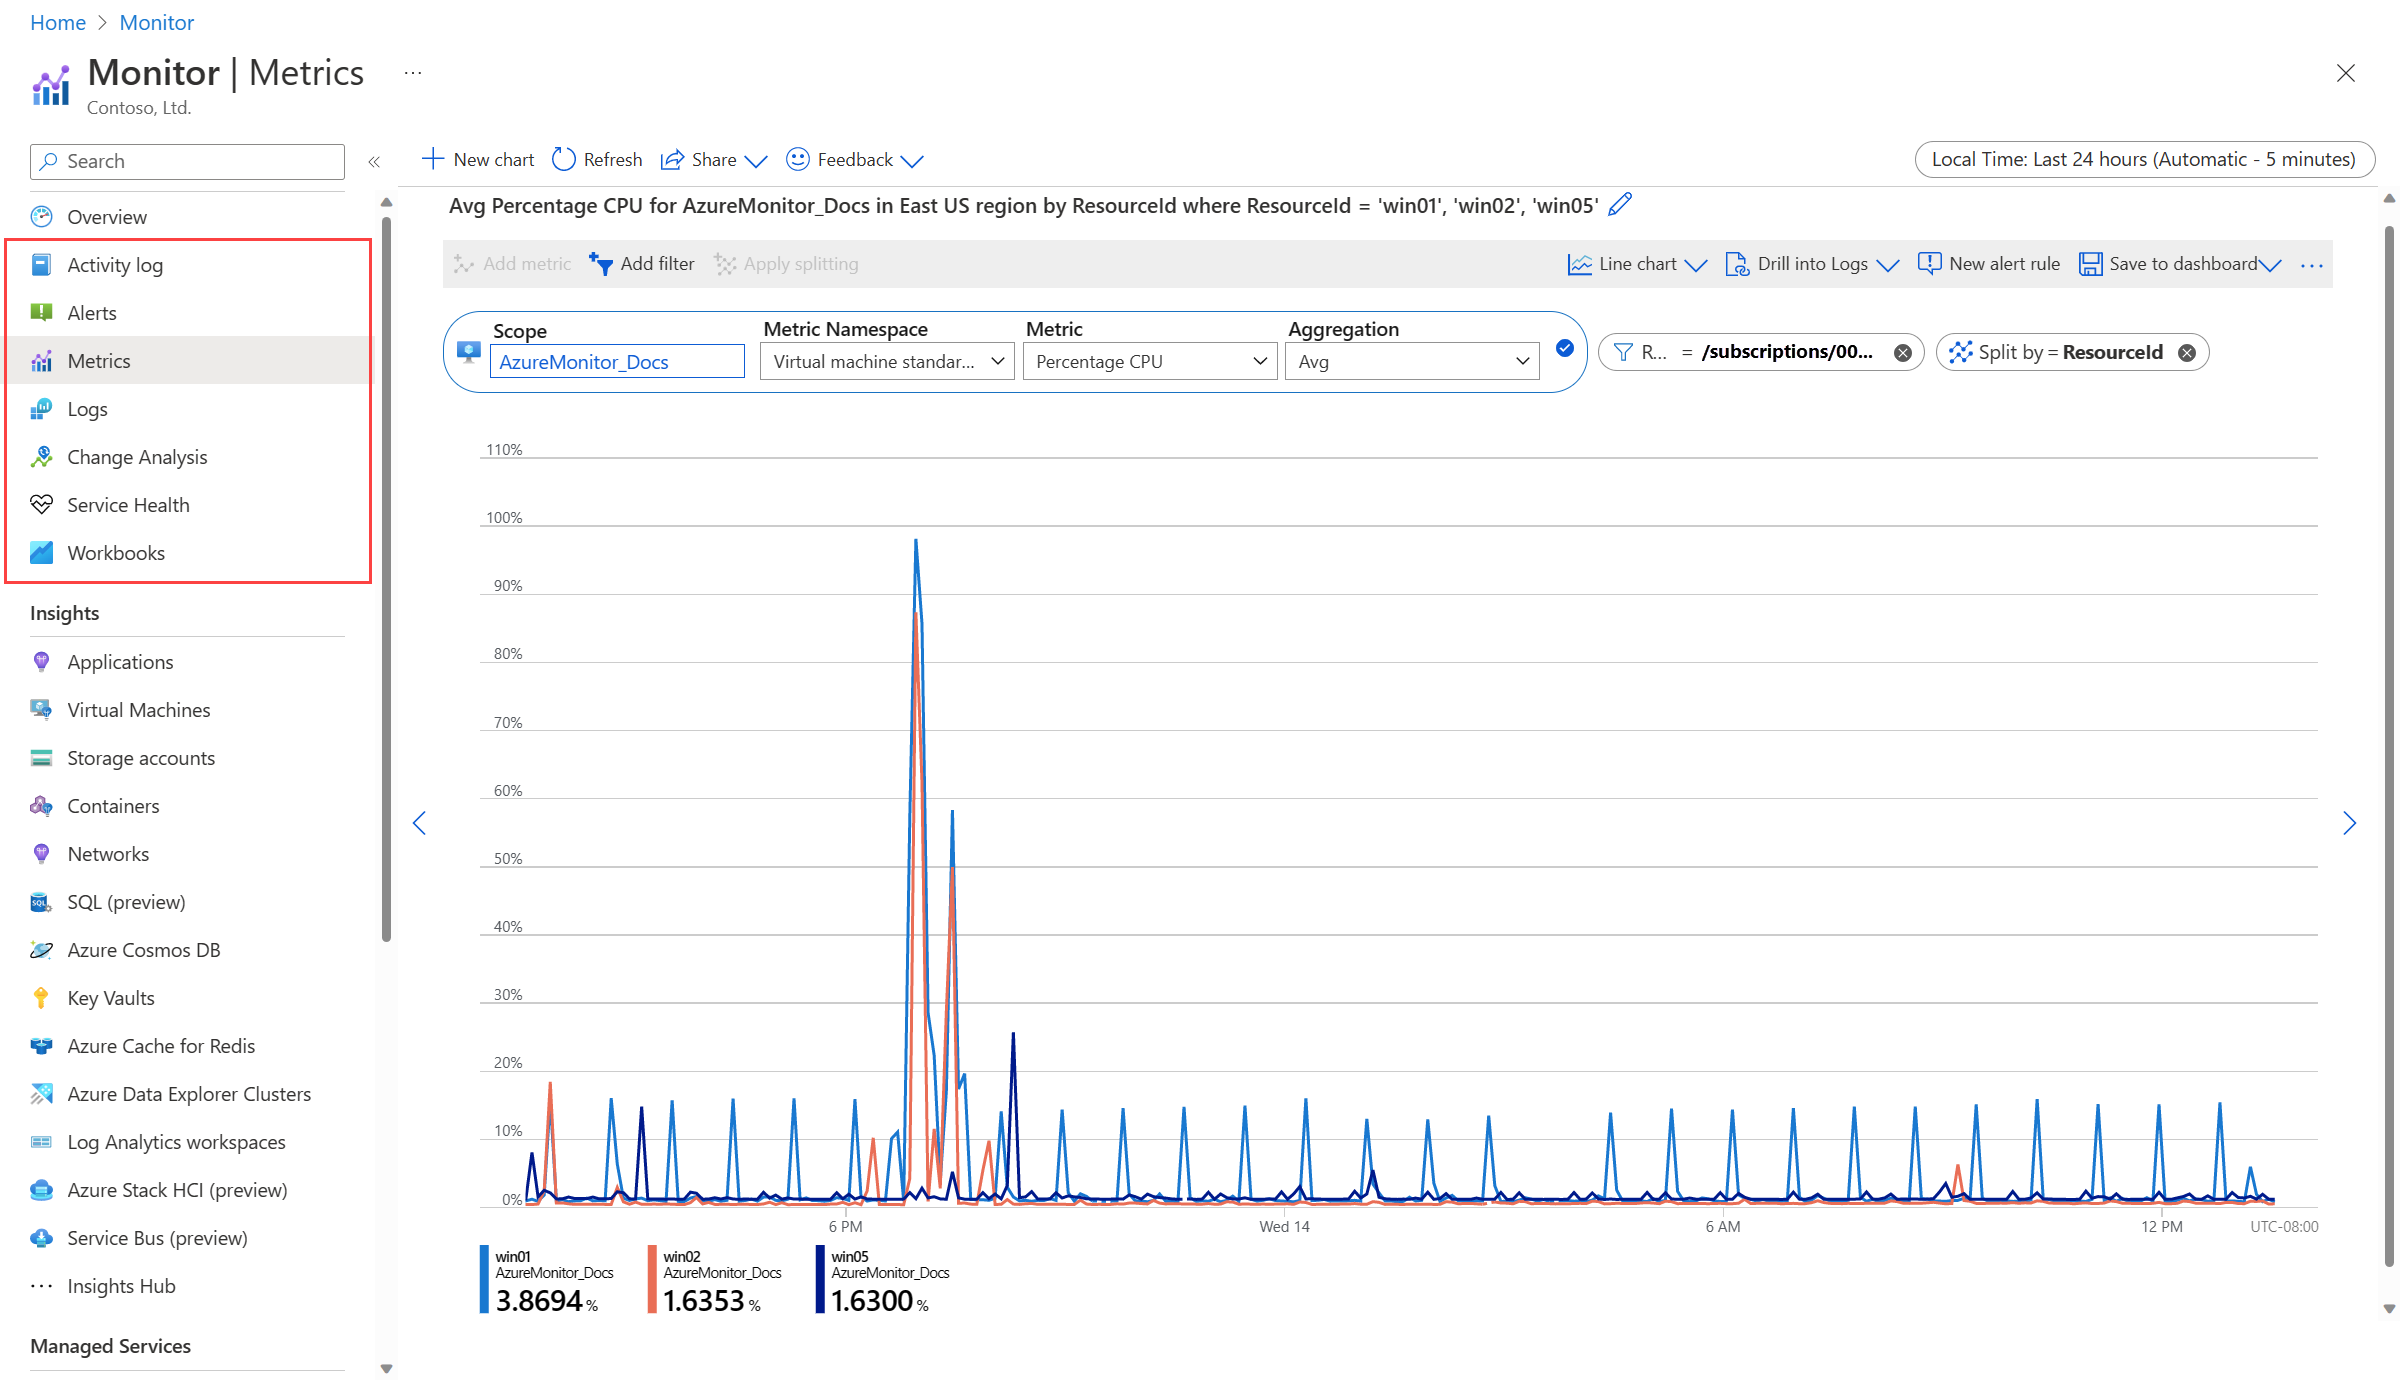
| Metrics | Open metrics explorer with no scope selected. This feature is particularly useful when you want to compare trends across multiple machines. Select a subscription or a resource group to quickly add a group of machines to analyze together. |
| Logs | Open Log Analytics with the scope set to the workspace. You can select from various existing queries to drill into log and performance data for all machines. Or you can create a custom query to perform additional analysis. |
| Workbooks | Open the workbook gallery with the VM insights workbooks for multiple machines. For a list of the VM insights workbooks designed for multiple machines, see VM insights workbooks. |
VM insights experience
VM insights includes multiple performance charts that help you quickly get a status of the operation of your monitored machines, their trending performance over time, and dependencies between machines and processes. It also offers a consolidated view of different aspects of any monitored machine, such as its properties and events collected in the Log Analytics workspace.
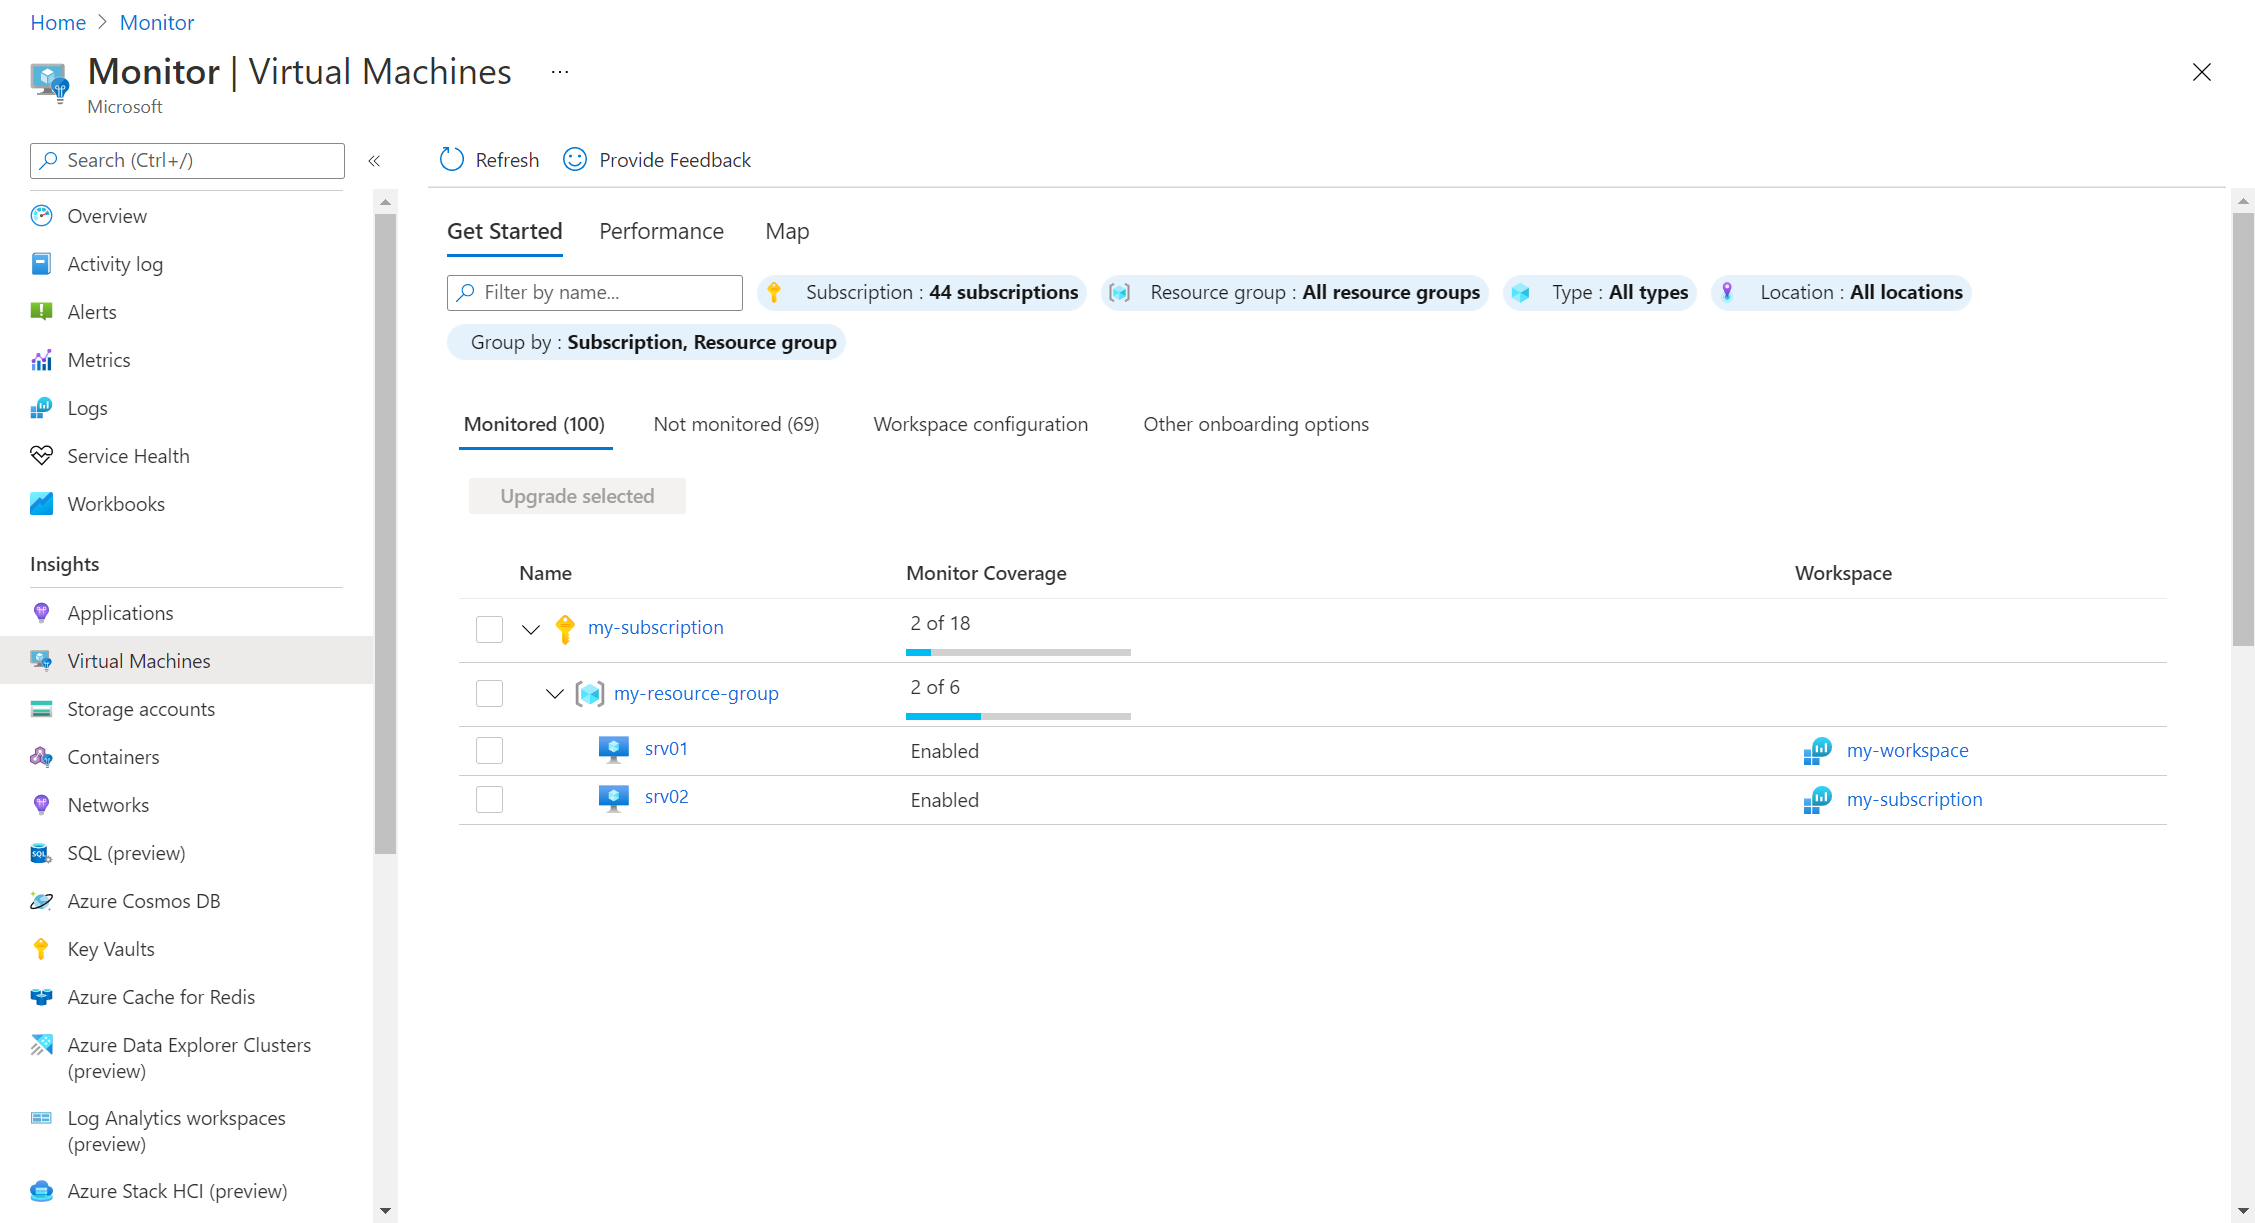
The Get Started tab displays all machines in your Azure subscription and identifies which ones are being monitored. Use this view to quickly identify which machines aren't being monitored and to onboard individual machines that aren't already being monitored.
The Performance view includes multiple charts with several key performance indicators (KPIs) to help you determine how well machines are performing. The charts show resource utilization over a period of time. You can use them to identify bottlenecks, see anomalies, or switch to a perspective listing each machine to view resource utilization based on the metric selected. For details on how to use the Performance view, see Chart performance with VM insights.
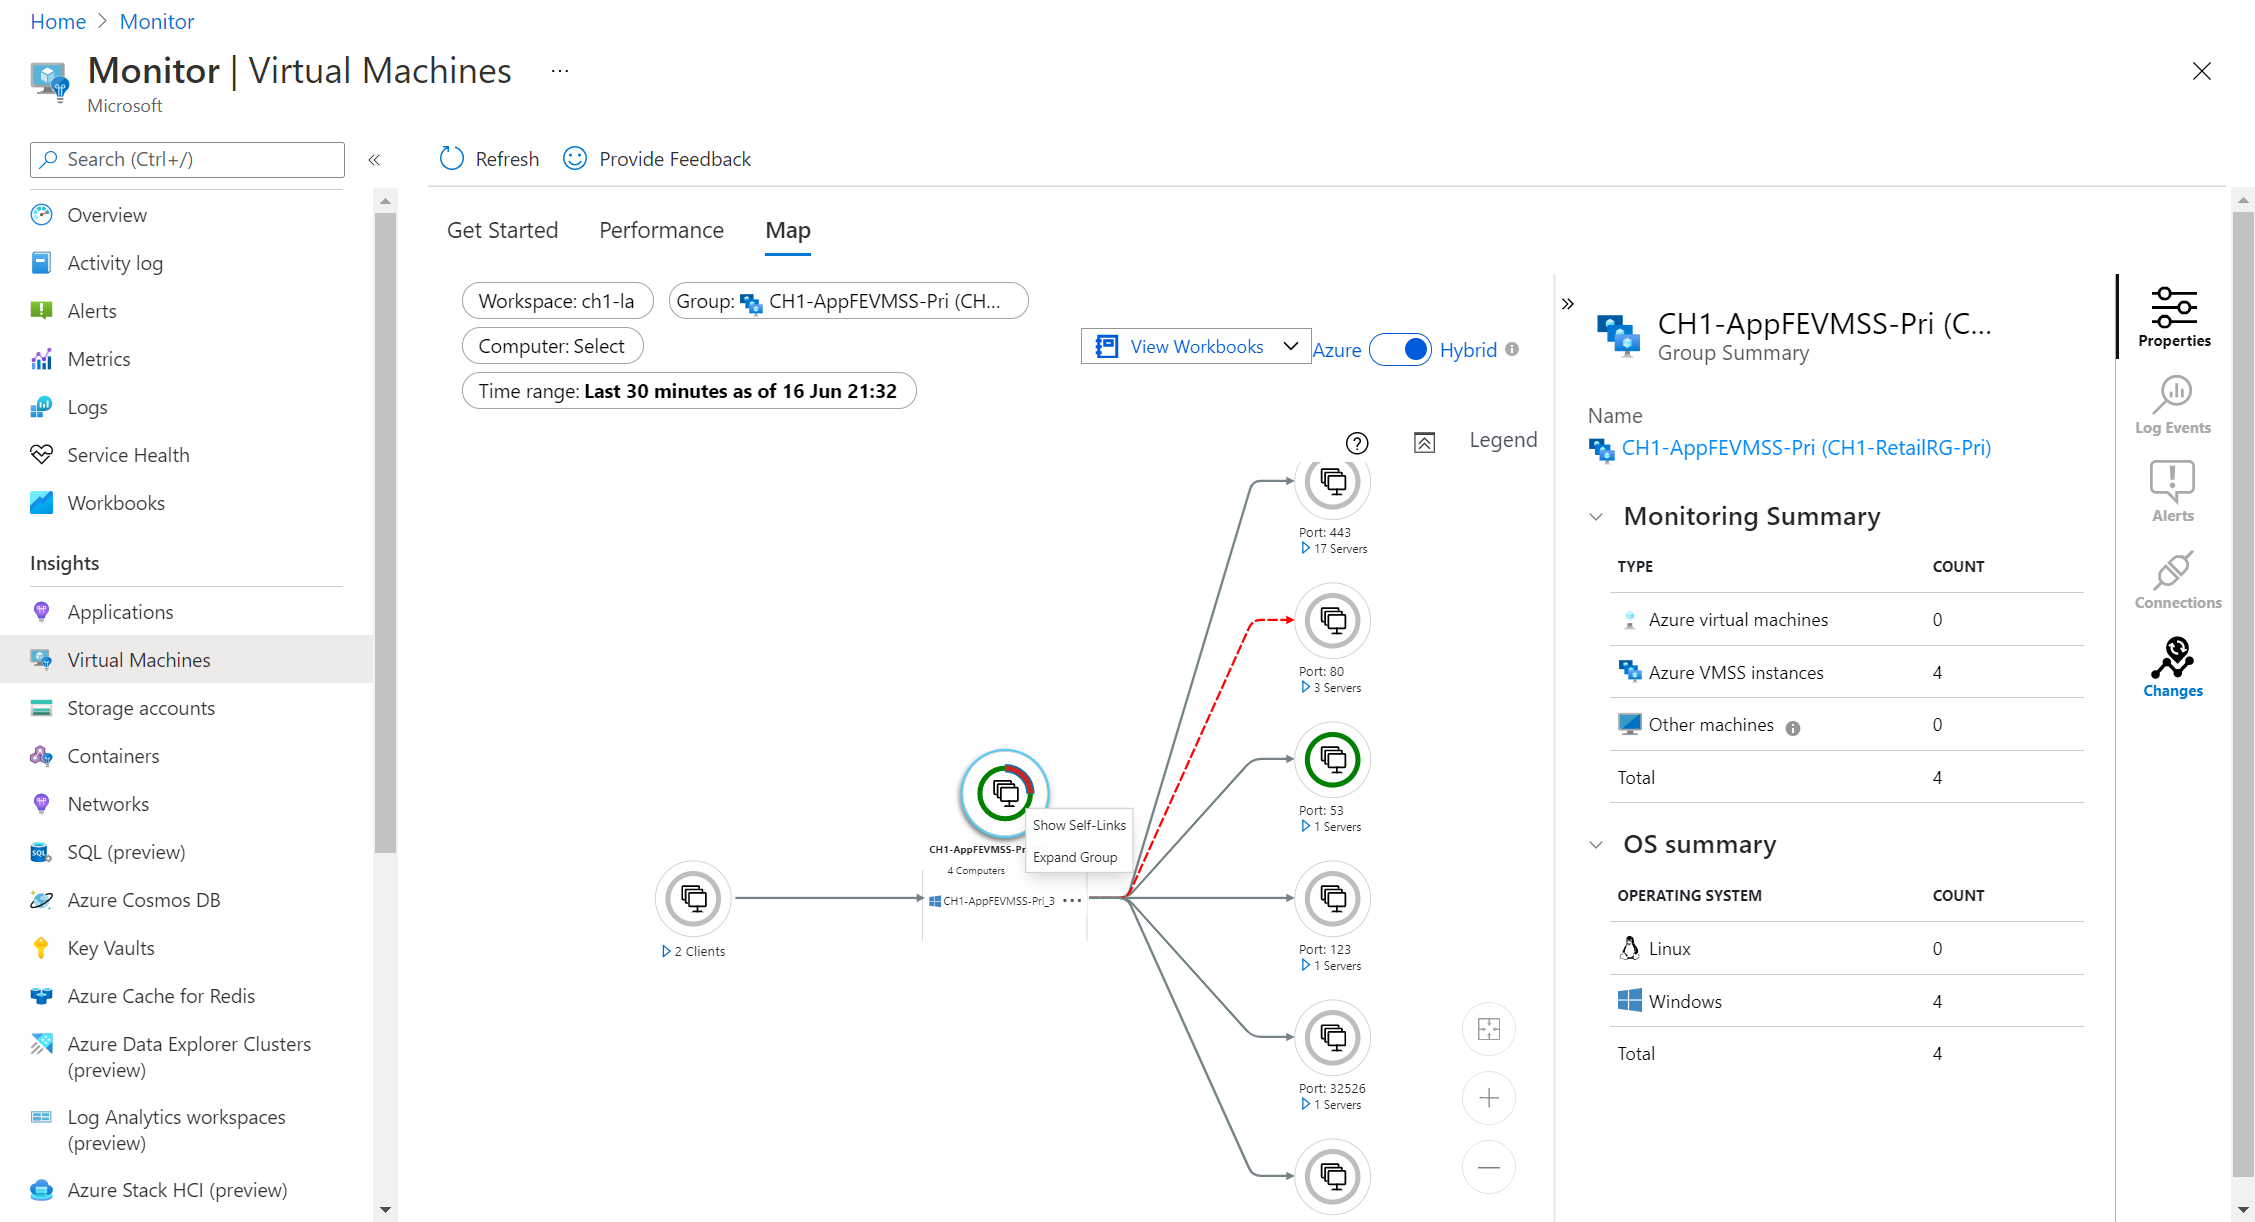
Use the Map view to see running processes on machines and their dependencies on other machines and external processes. You can change the time window for the view to determine if these dependencies have changed from another time period. For details on how to use the Map view, see Use the Map feature of VM insights to understand application components.
Compare Metrics and Logs
For many features of Azure Monitor, you don't need to understand the different types of data it uses and where it's stored. You can use VM insights, for example, without any understanding of what data is being used to populate the Performance view, Map view, and workbooks. You just focus on the logic that you're analyzing. As you dig deeper, you need to understand the difference between Azure Monitor Metrics and Azure Monitor Logs. Different features of Azure Monitor use different kinds of data. The type of alerting that you use for a particular scenario depends on having that data available in a particular location.
This level of detail can be confusing if you're new to Azure Monitor. The following information helps you understand the differences between the types of data:
- Any non-numeric data, such as events, is stored in Logs. Metrics can only include numeric data sampled at regular intervals.
- Numeric data can be stored in both Metrics and Logs so that it can be analyzed in different ways and support different types of alerts.
- The Azure Monitor agent sends performance data from the guest operating system to either Metrics, Logs, or both.
- VM insights sends performance data from the guest operating system to Logs.
Analyze metric data with metrics explorer
By using metrics explorer, you can plot charts, visually correlate trends, and investigate spikes and dips in metrics' values. For details on how to use this tool, see Analyze metrics with Azure Monitor metrics explorer.
The following namespaces are used by virtual machines.
| Namespace | Description | Requirement |
|---|---|---|
| Virtual Machine Host | Host metrics automatically collected for all Azure virtual machines. Detailed list of metrics at Microsoft.Compute/virtualMachines. | Collected automatically with no configuration required. |
| Virtual Machine Guest | Guest operating system and application performance data on Windows machines. | Azure Monitor agent installed with a Data Collection Rule. |
| azure.vm.linux.guestmetrics | Guest operating system and application performance data on Linux machines. | Azure Monitor agent installed with a Data Collection Rule. |
Analyze log data with Log Analytics
Use Log Analytics to perform custom analysis of your log data to dig deeper into the data used to create the views in workbooks and VM insights. Consider analyzing different logic and aggregations of that data, or correlate security data collected by Microsoft Defender for Cloud and Microsoft Sentinel with your health and availability data.
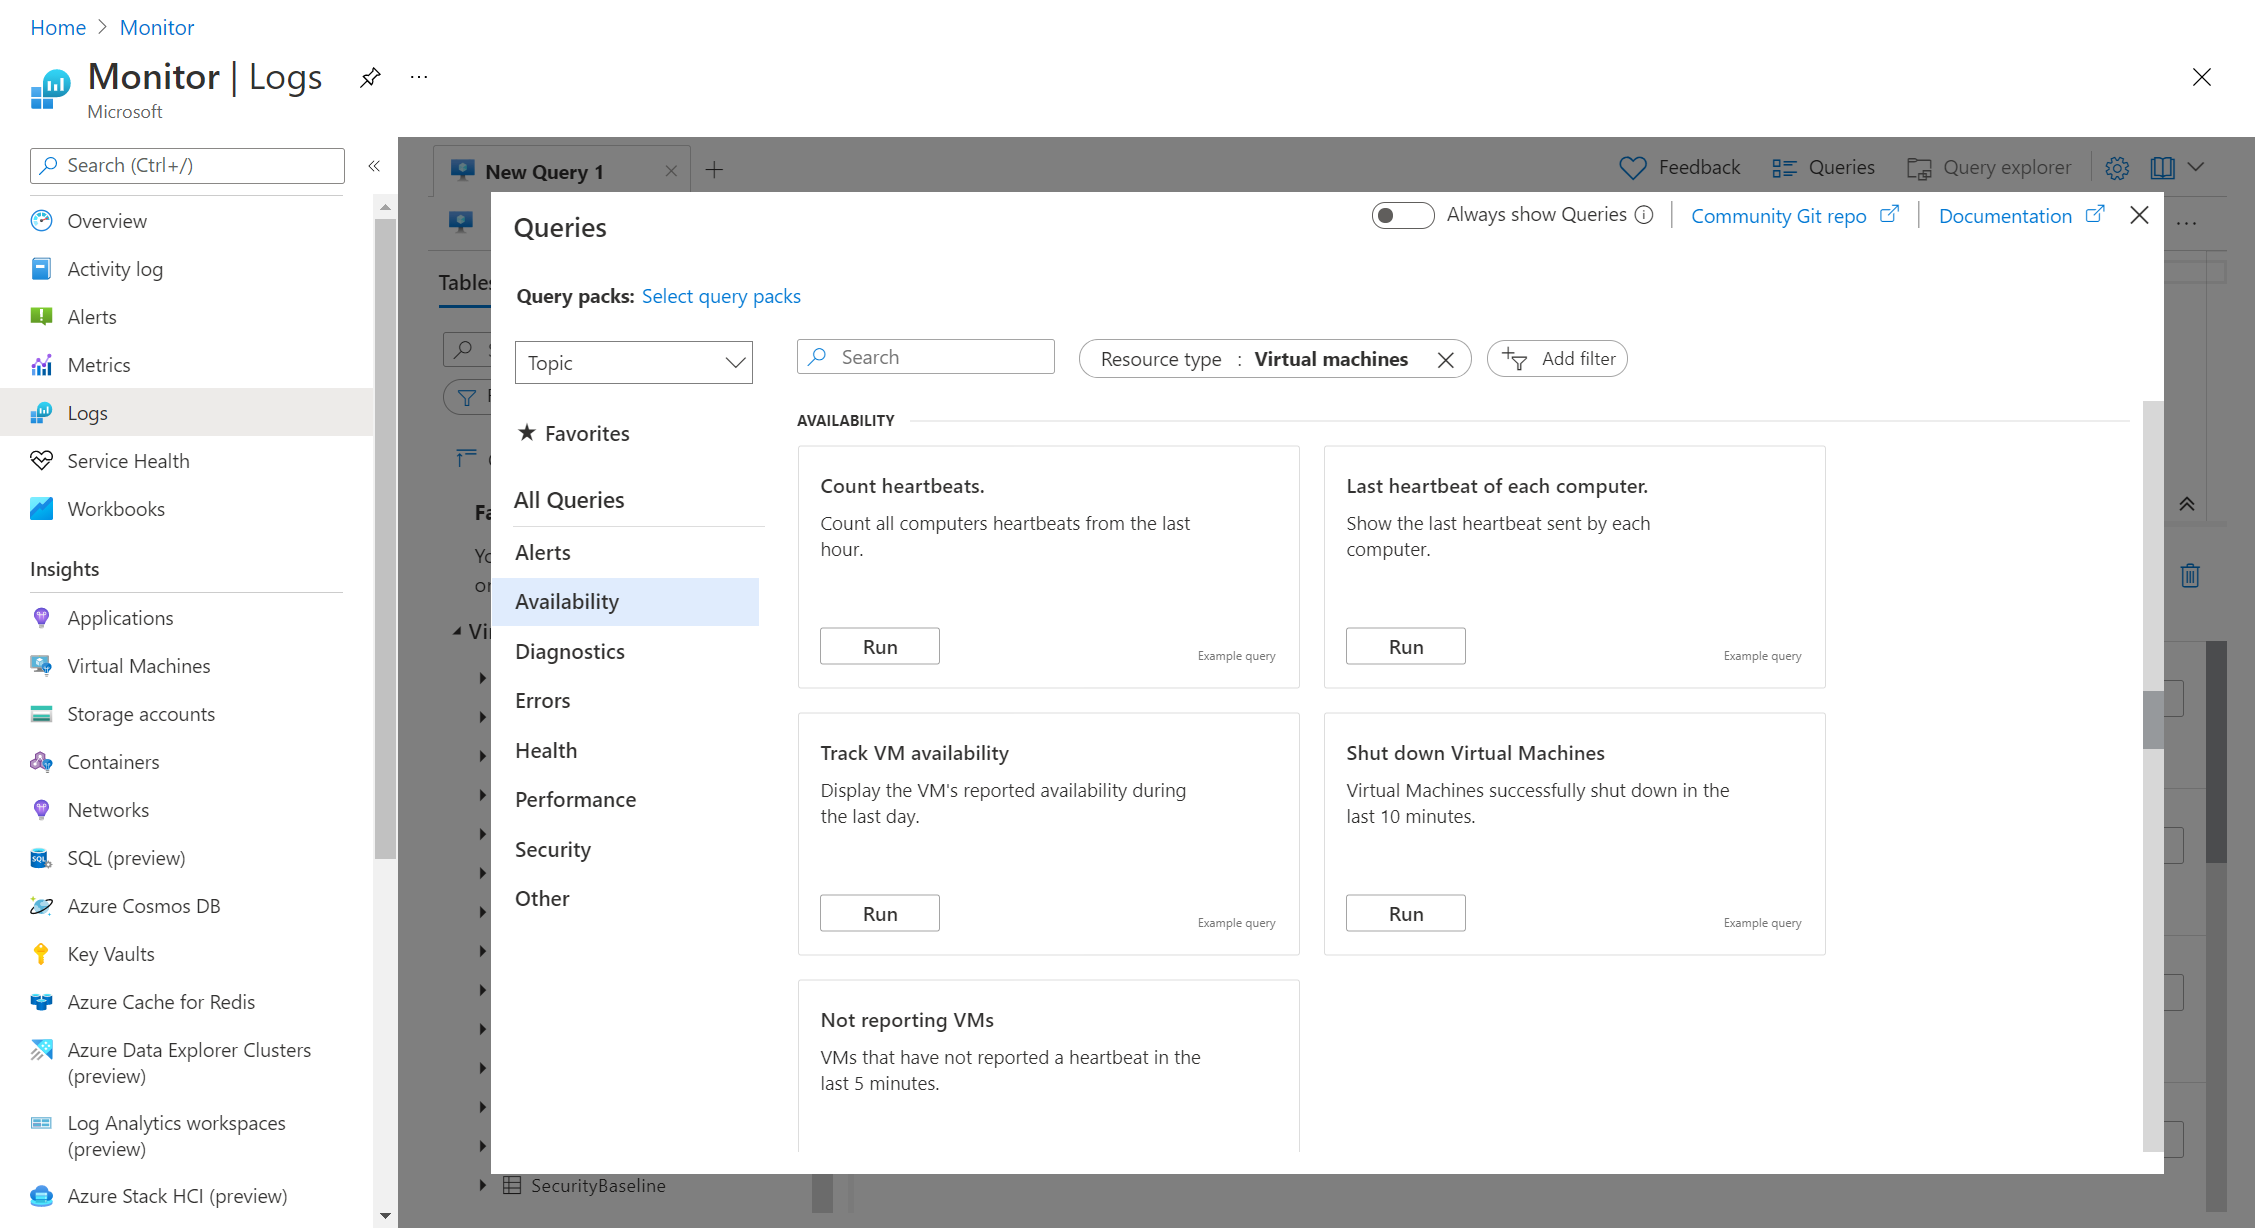
You don't necessarily need to understand how to write a log query to use Log Analytics. There are multiple prebuilt queries that you can select and either run without modification or use as a start to a custom query. Select Queries at the top of the Log Analytics screen, and view queries with a Resource type of Virtual machines or Virtual machine scale sets. For information on how to use these queries, see Using queries in Azure Monitor Log Analytics. For a tutorial on how to use Log Analytics to run queries and work with their results, see Log Analytics tutorial.
When you start Log Analytics from the Logs menu for a machine, its scope is set to that computer. Any queries only return records associated with that computer. For a simple query that returns all records in a table, double-click a table in the left pane. Work with these results or modify the query for more complex analysis. To set the scope to all records in a workspace, change the scope or select Logs from the Monitor menu.
Visualize data with workbooks
Workbooks provide interactive reports in the Azure portal and combine different kinds of data into a single view. Workbooks combine text, log queries, metrics, and parameters into rich interactive reports. Workbooks are editable by any other team members who have access to the same Azure resources.
Workbooks are helpful for scenarios such as:
- Exploring the usage of your virtual machine when you don't know the metrics of interest in advance like CPU utilization, disk space, memory, and network dependencies. Unlike other usage analytics tools, workbooks let you combine multiple kinds of visualizations and analyses, which make them great for this kind of free-form exploration.
- Explaining to your team how a recently provisioned VM is performing, by showing metrics for key counters and other log events.
- Sharing the results of a resizing experiment of your VM with other members of your team. You can explain the goals for the experiment with text. Then you can show each usage metric and analytics queries used to evaluate the experiment, along with clear call-outs for whether each metric was above or below target.
- Reporting the impact of an outage on the usage of your VM, combining data, text explanation, and a discussion of next steps to prevent outages in the future.
VM insights include the following workbooks. You can use these workbooks or use them as a start to create custom workbooks to address your particular requirements.
Single virtual machine
| Workbook | Description |
|---|---|
| Performance | Provides a customizable version of the Performance view that uses all the Log Analytics performance counters that you enabled. |
| Connections | Provides an in-depth view of the inbound and outbound connections from your VM. |
Multiple virtual machines
| Workbook | Description |
|---|---|
| Performance | Provides a customizable version of the Top N List and Charts view in a single workbook that uses all the Log Analytics performance counters that you enabled. |
| Performance counters | Provides a Top N Chart view across a wide set of performance counters. |
| Connections | Provides an in-depth view of the inbound and outbound connections from your monitored machines. |
| Active Ports | Provides a list of the processes bound to the ports on the monitored machines and their activity in the chosen timeframe. |
| Open Ports | Provides the number of ports open on your monitored machines and the details on those open ports. |
| Failed Connections | Displays the count of failed connections on your monitored machines, the failure trend, and if the percentage of failures is increasing over time. |
| Security and Audit | Provides an analysis of your TCP/IP traffic that reports on overall connections, malicious connections, and where the IP endpoints reside globally. To enable all features, you need to enable Security Detection. |
| TCP Traffic | Provides a ranked report for your monitored machines and their sent, received, and total network traffic in a grid and displayed as a trend line. |
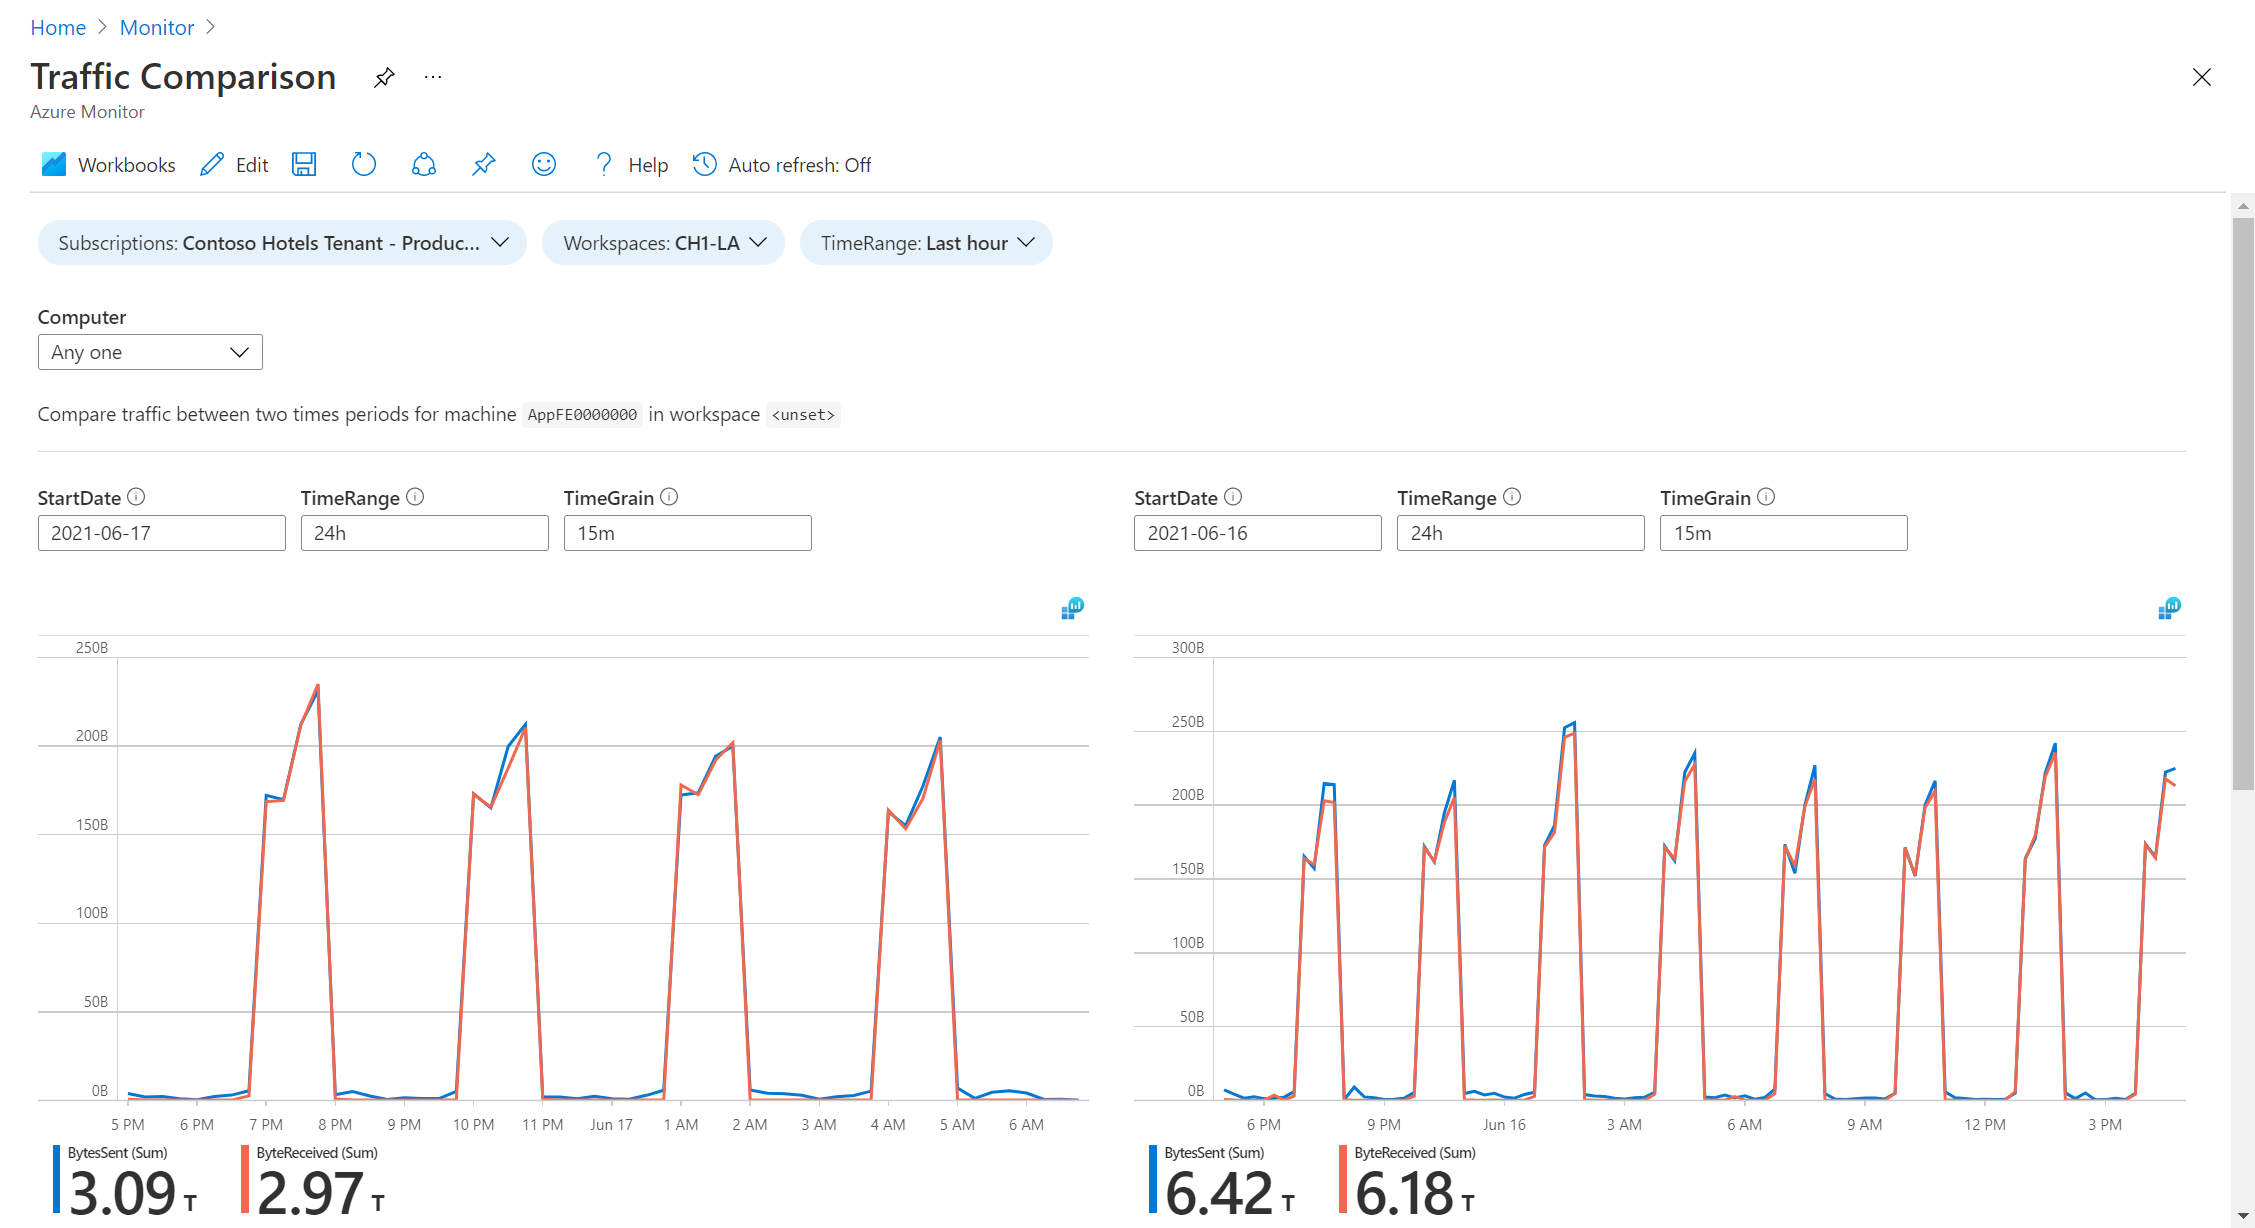
| Traffic Comparison | Compares network traffic trends for a single machine or a group of machines. |
| AMA Migration Helper | Helps you discover what to migrate and track progress as you move from Log Analytics Agent to Azure Monitor Agent. This workbook isn't available from VM insights like the other workbooks. On the Azure Monitor menu, go to Workbooks and select Public Templates. See Tools for migrating from Log Analytics Agent to Azure Monitor Agent |
For instructions on how to create your own custom workbooks, see Create interactive reports VM insights with workbooks.
