Customize collection using CRDs (Service and Pod Monitors)
The enablement of Managed Prometheus automatically deploys the custom resource definitions (CRD) for pod monitors and service monitors. These custom resource definitions are the same custom resource definitions (CRD) as OSS Pod monitors and OSS service monitors for Prometheus, except for a change in the group name. If you have existing Prometheus CRDs and custom resources on your cluster, these CRDs won't conflict with the CRDs created by the add-on. At the same time, the managed Prometheus addon does not pick up the CRDs created for the OSS Prometheus. This separation is intentional for the purposes of isolation of scrape jobs.
Note
Support for custom resources definitions (CRDs) in Azure ARC-enabled Kubernetes is currently not available.
Create a Pod or Service Monitor
Use the Pod and Service Monitor templates and follow the API specification to create your custom resources(PodMonitor and Service Monitor). Note that the only change required to the existing OSS CRs(Custom Resources) for being picked up by the Managed Prometheus is the API group - azmonitoring.coreos.com/v1.
Note - Please make sure to use the labelLimit, labelNameLengthLimit and labelValueLengthLimit specified in the templates so that they are not dropped during processing.
Your pod and service monitors should look like the following examples:
Example Pod Monitor
# Note the API version is azmonitoring.coreos.com/v1 instead of monitoring.coreos.com/v1
apiVersion: azmonitoring.coreos.com/v1
kind: PodMonitor

# Can be deployed in any namespace
metadata:
  name: reference-app
  namespace: app-namespace
spec:
  labelLimit: 63
  labelNameLengthLimit: 511
  labelValueLengthLimit: 1023

  # The selector specifies which pods to filter for
  selector:

    # Filter by pod labels
    matchLabels:
      environment: test
    matchExpressions:
      - key: app
        operator: In
        values: [app-frontend, app-backend]

    # [Optional] Filter by pod namespace
    namespaceSelector:
      matchNames: [app-frontend, app-backend]

  # [Optional] Labels on the pod with these keys will be added as labels to each metric scraped
  podTargetLabels: [app, region, environment]

  # Multiple pod endpoints can be specified. Port requires a named port.
  podMetricsEndpoints:
    - port: metrics
Example Service Monitor
# Note the API version is azmonitoring.coreos.com/v1 instead of monitoring.coreos.com/v1
apiVersion: azmonitoring.coreos.com/v1
kind: ServiceMonitor

# Can be deployed in any namespace
metadata:
  name: reference-app
  namespace: app-namespace
spec:
  labelLimit: 63
  labelNameLengthLimit: 511
  labelValueLengthLimit: 1023

  # The selector filters endpoints by service labels.
  selector:
    matchLabels:
      app: reference-app

  # Multiple endpoints can be specified. Port requires a named port.
  endpoints:
  - port: metrics
Deploy a Pod or Service Monitor
You can then deploy the pod or service monitor using kubectl apply.
When applied, any errors in the custom resources should show up and the pod or service monitors should fail to apply.
A successful pod monitor creation looks like the following -
podmonitor.azmonitoring.coreos.com/my-pod-monitor created
Examples
Create a sample application
Deploy a sample application exposing prometheus metrics to be configured by pod/service monitor.
kubectl apply -f https://github.com/Azure/prometheus-collector/blob/main/internal/referenceapp/prometheus-reference-app.yaml
Create a pod monitor and/or service monitor to scrape metrics
Deploy a pod monitor that is configured to scrape metrics from the example application from the previous step.
Pod Monitor
kubectl apply -f https://github.com/Azure/prometheus-collector/blob/main/otelcollector/deploy/example-custom-resources/pod-monitor/pod-monitor-reference-app.yaml
Service Monitor
kubectl apply -f https://github.com/Azure/prometheus-collector/blob/main/otelcollector/deploy/example-custom-resources/service-monitor/service-monitor-reference-app.yaml
Troubleshooting
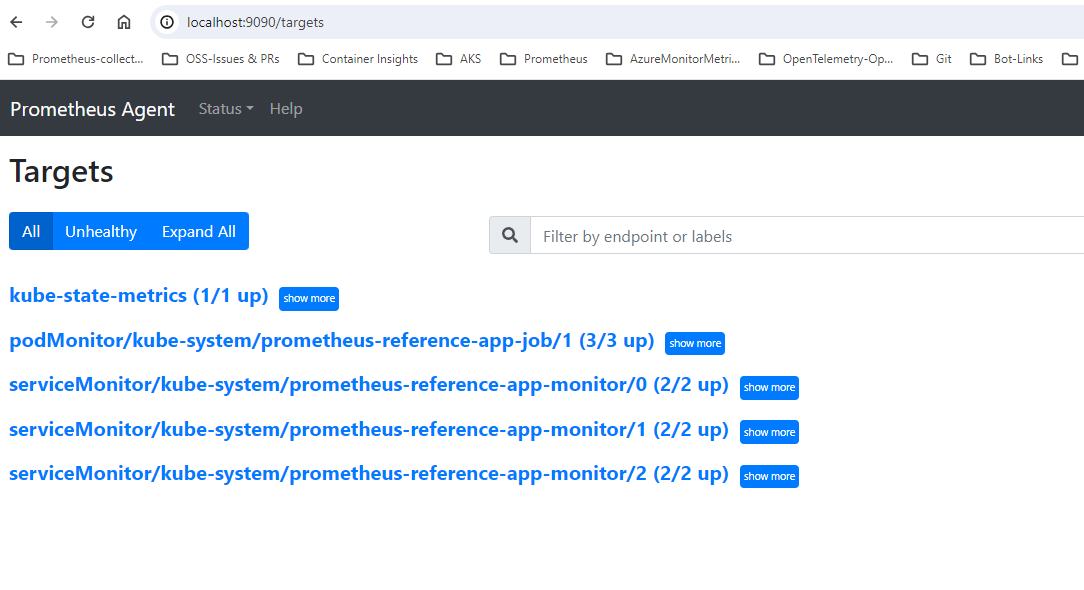
When the pod or service monitors are successfully applied, the addon should automatically start collecting metrics from the targets. To confirm this, follow the instructions here for general troubleshooting of custom resources and also to ensure the targets show up in 127.0.0.1/targets.
