How to configure monitoring for Azure Functions
Azure Functions integrates with Application Insights to better enable you to monitor your function apps. Application Insights, a feature of Azure Monitor, is an extensible Application Performance Management (APM) service that collects data generated by your function app, including information your app writes to logs. Application Insights integration is typically enabled when your function app is created. If your app doesn't have the instrumentation key set, you must first enable Application Insights integration.
You can use Application Insights without any custom configuration. However, the default configuration can result in high volumes of data. If you're using a Visual Studio Azure subscription, you might hit your data cap for Application Insights. For information about Application Insights costs, see Application Insights billing. For more information, see Solutions with high-volume of telemetry.
In this article, you learn how to configure and customize the data that your functions send to Application Insights. You can set common logging configurations in the host.json file. By default, these settings also govern custom logs emitted by your code. However, in some cases this behavior can be disabled in favor of options that give you more control over logging. For more information, see Custom application logs.
Note
You can use specially configured application settings to represent specific settings in a host.json file for a particular environment. Doing so lets you effectively change host.json settings without needing to republish the host.json file in your project. For more information, see Override host.json values.
Custom application logs
By default, custom application logs you write are sent to the Functions host, which then sends them to Application Insights under the Worker category. Some language stacks allow you to instead send the logs directly to Application Insights, which gives you full control over how logs you write are emitted. In this case, the logging pipeline changes from worker -> Functions host -> Application Insights to worker -> Application Insights.
The following table summarizes the configuration options available for each stack:
| Language stack | Where to configure custom logs |
|---|---|
| .NET (in-process model) | host.json |
| .NET (isolated model) | Default (send custom logs to the Functions host): host.jsonTo send logs directly to Application Insights, see: Configure Application Insights in the HostBuilder |
| Node.js | host.json |
| Python | host.json |
| Java | Default (send custom logs to the Functions host): host.jsonTo send logs directly to Application Insights, see: Configure the Application Insights Java agent |
| PowerShell | host.json |
When you configure custom application logs to be sent directly, the host no longer emits them, and host.json no longer controls their behavior. Similarly, the options exposed by each stack apply only to custom logs, and they don't change the behavior of the other runtime logs described in this article. In this case, to control the behavior of all logs, you might need to make changes in both configurations.
Configure categories
The Azure Functions logger includes a category for every log. The category indicates which part of the runtime code or your function code wrote the log. Categories differ between version 1.x and later versions.
Category names are assigned differently in Functions compared to other .NET frameworks. For example, when you use ILogger<T> in ASP.NET, the category is the name of the generic type. C# functions also use ILogger<T>, but instead of setting the generic type name as a category, the runtime assigns categories based on the source. For example:
- Entries related to running a function are assigned a category of
Function.<FUNCTION_NAME>. - Entries created by user code inside the function, such as when calling
logger.LogInformation(), are assigned a category ofFunction.<FUNCTION_NAME>.User.
The following table describes the main categories of logs that the runtime creates:
| Category | Table | Description |
|---|---|---|
Function |
traces | Includes function started and completed logs for all function runs. For successful runs, these logs are at the Information level. Exceptions are logged at the Error level. The runtime also creates Warning level logs, such as when queue messages are sent to the poison queue. |
Function.<YOUR_FUNCTION_NAME> |
dependencies | Dependency data is automatically collected for some services. For successful runs, these logs are at the Information level. For more information, see Dependencies. Exceptions are logged at the Error level. The runtime also creates Warning level logs, such as when queue messages are sent to the poison queue. |
Function.<YOUR_FUNCTION_NAME> |
customMetrics customEvents |
C# and JavaScript SDKs lets you collect custom metrics and log custom events. For more information, see Custom telemetry data. |
Function.<YOUR_FUNCTION_NAME> |
traces | Includes function started and completed logs for specific function runs. For successful runs, these logs are at the Information level. Exceptions are logged at the Error level. The runtime also creates Warning level logs, such as when queue messages are sent to the poison queue. |
Function.<YOUR_FUNCTION_NAME>.User |
traces | User-generated logs, which can be any log level. For more information about writing to logs from your functions, see Writing to logs. |
Host.Aggregator |
customMetrics | These runtime-generated logs provide counts and averages of function invocations over a configurable period of time. The default period is 30 seconds or 1,000 results, whichever comes first. Examples are the number of runs, success rate, and duration. All of these logs are written at the Information level. If you filter at Warning or higher, you don't see any of this data. |
Host.Results |
requests | These runtime-generated logs indicate success or failure of a function. All of these logs are written at the Information level. If you filter at Warning or higher, you don't see any of this data. |
Microsoft |
traces | Fully qualified log category that reflects a .NET runtime component invoked by the host. |
Worker |
traces | Logs generated by the language worker process for non-.NET languages. Language worker logs might also be logged in a Microsoft.* category, such as Microsoft.Azure.WebJobs.Script.Workers.Rpc.RpcFunctionInvocationDispatcher. These logs are written at the Information level. |
Note
For .NET class library functions, these categories assume you're using ILogger and not ILogger<T>. For more information, see the Functions ILogger documentation.
The Table column indicates to which table in Application Insights the log is written.
Configure log levels
A log level is assigned to every log. The value is an integer that indicates relative importance:
| LogLevel | Code | Description |
|---|---|---|
| Trace | 0 | Logs that contain the most detailed messages. These messages might contain sensitive application data. These messages are disabled by default and should never be enabled in a production environment. |
| Debug | 1 | Logs that are used for interactive investigation during development. These logs should primarily contain information useful for debugging and have no long-term value. |
| Information | 2 | Logs that track the general flow of the application. These logs should have long-term value. |
| Warning | 3 | Logs that highlight an abnormal or unexpected event in the application flow, but don't otherwise cause the application execution to stop. |
| Error | 4 | Logs that highlight when the current flow of execution is stopped because of a failure. These errors should indicate a failure in the current activity, not an application-wide failure. |
| Critical | 5 | Logs that describe an unrecoverable application or system crash, or a catastrophic failure that requires immediate attention. |
| None | 6 | Disables logging for the specified category. |
The host.json file configuration determines how much logging a functions app sends to Application Insights.
For each category, you indicate the minimum log level to send. The host.json settings vary depending on the Functions runtime version.
The following examples define logging based on the following rules:
- The default logging level is set to
Warningto prevent excessive logging for unanticipated categories. Host.AggregatorandHost.Resultsare set to lower levels. Setting logging levels too high (especially higher thanInformation) can result in loss of metrics and performance data.- Logging for function runs is set to
Information. If necessary, you can override this setting in local development toDebugorTrace.
{
  "logging": {
    "fileLoggingMode": "debugOnly",
    "logLevel": {
      "default": "Warning",
      "Host.Aggregator": "Trace",
      "Host.Results": "Information",
      "Function": "Information"
    }
  }
}
If host.json includes multiple logs that start with the same string, the more defined logs ones are matched first. Consider the following example that logs everything in the runtime, except Host.Aggregator, at the Error level:
{
  "logging": {
    "fileLoggingMode": "debugOnly",
    "logLevel": {
      "default": "Information",
      "Host": "Error",
      "Function": "Error",
      "Host.Aggregator": "Information"
    }
  }
}
You can use a log level setting of None to prevent any logs from being written for a category.
Caution
Azure Functions integrates with Application Insights by storing telemetry events in Application Insights tables. If you set a category log level to any value different from Information, it prevents the telemetry from flowing to those tables, and you won't be able to see related data in the Application Insights and Function Monitor tabs.
For example, for the previous samples:
- If you set the
Host.Resultscategory to theErrorlog level, Azure gathers only host execution telemetry events in therequeststable for failed function executions, preventing the display of host execution details of successful executions in both the Application Insights and Function Monitor tabs. - If you set the
Functioncategory to theErrorlog level, it stops gathering function telemetry data related todependencies,customMetrics, andcustomEventsfor all the functions, preventing you from viewing any of this data in Application Insights. Azure gathers onlytraceslogged at theErrorlevel.
In both cases, Azure continues to collect errors and exceptions data in the Application Insights and Function Monitor tabs. For more information, see Solutions with high-volume of telemetry.
Configure the aggregator
As noted in the previous section, the runtime aggregates data about function executions over a period of time. The default period is 30 seconds or 1,000 runs, whichever comes first. You can configure this setting in the host.json file. For example:
{
    "aggregator": {
      "batchSize": 1000,
      "flushTimeout": "00:00:30"
    }
}
Configure sampling
Application Insights has a sampling feature that can protect you from producing too much telemetry data on completed executions at times of peak load. When the rate of incoming executions exceeds a specified threshold, Application Insights starts to randomly ignore some of the incoming executions. The default setting for maximum number of executions per second is 20 (five in version 1.x). You can configure sampling in host.json. Here's an example:
{
  "logging": {
    "applicationInsights": {
      "samplingSettings": {
        "isEnabled": true,
        "maxTelemetryItemsPerSecond" : 20,
        "excludedTypes": "Request;Exception"
      }
    }
  }
}
You can exclude certain types of telemetry from sampling. In this example, data of type Request and Exception is excluded from sampling. It ensures that all function executions (requests) and exceptions are logged while other types of telemetry remain subject to sampling.
If your project uses a dependency on the Application Insights SDK to do manual telemetry tracking, you might experience unusual behavior if your sampling configuration differs from the sampling configuration in your function app. In such cases, use the same sampling configuration as the function app. For more information, see Sampling in Application Insights.
Enable SQL query collection
Application Insights automatically collects data on dependencies for HTTP requests, database calls, and for several bindings. For more information, see Dependencies. For SQL calls, the name of the server and database is always collected and stored, but SQL query text isn't collected by default. You can use dependencyTrackingOptions.enableSqlCommandTextInstrumentation to enable SQL query text logging by using the following settings (at a minimum) in your host.json file:
"logging": {
    "applicationInsights": {
        "enableDependencyTracking": true,
        "dependencyTrackingOptions": {
            "enableSqlCommandTextInstrumentation": true
        }
    }
}
For more information, see Advanced SQL tracking to get full SQL query.
Configure scale controller logs
This feature is in preview.
You can have the Azure Functions scale controller emit logs to either Application Insights or to Blob storage to better understand the decisions the scale controller is making for your function app.
To enable this feature, add an application setting named SCALE_CONTROLLER_LOGGING_ENABLED to your function app settings. The following value of the setting must be in the format <DESTINATION>:<VERBOSITY>. For more information, see the following table:
| Property | Description |
|---|---|
<DESTINATION> |
The destination to which logs are sent. Valid values are AppInsights and Blob.When you use AppInsights, ensure that the Application Insights is enabled in your function app.When you set the destination to Blob, logs are created in a blob container named azure-functions-scale-controller in the default storage account set in the AzureWebJobsStorage application setting. |
<VERBOSITY> |
Specifies the level of logging. Supported values are None, Warning, and Verbose.When set to Verbose, the scale controller logs a reason for every change in the worker count, and information about the triggers that factor into those decisions. Verbose logs include trigger warnings and the hashes used by the triggers before and after the scale controller runs. |
Tip
Keep in mind that while you leave scale controller logging enabled, it impacts the potential costs of monitoring your function app. Consider enabling logging until you have collected enough data to understand how the scale controller is behaving, and then disabling it.
For example, the following Azure CLI command turns on verbose logging from the scale controller to Application Insights:
az functionapp config appsettings set --name <FUNCTION_APP_NAME> \
--resource-group <RESOURCE_GROUP_NAME> \
--settings SCALE_CONTROLLER_LOGGING_ENABLED=AppInsights:Verbose
In this example, replace <FUNCTION_APP_NAME> and <RESOURCE_GROUP_NAME> with the name of your function app and the resource group name, respectively.
The following Azure CLI command disables logging by setting the verbosity to None:
az functionapp config appsettings set --name <FUNCTION_APP_NAME> \
--resource-group <RESOURCE_GROUP_NAME> \
--settings SCALE_CONTROLLER_LOGGING_ENABLED=AppInsights:None
You can also disable logging by removing the SCALE_CONTROLLER_LOGGING_ENABLED setting using the following Azure CLI command:
az functionapp config appsettings delete --name <FUNCTION_APP_NAME> \
--resource-group <RESOURCE_GROUP_NAME> \
--setting-names SCALE_CONTROLLER_LOGGING_ENABLED
With scale controller logging enabled, you're now able to query your scale controller logs.
Enable Application Insights integration
For a function app to send data to Application Insights, it needs to connect to the Application Insights resource using only one of these application settings:
| Setting name | Description |
|---|---|
APPLICATIONINSIGHTS_CONNECTION_STRING |
This setting is recommended and is required when your Application Insights instance runs in a sovereign cloud. The connection string supports other new capabilities. |
APPINSIGHTS_INSTRUMENTATIONKEY |
Legacy setting, which Application Insights has deprecated in favor of the connection string setting. |
When you create your function app in the Azure portal from the command line by using Azure Functions Core Tools or Visual Studio Code, Application Insights integration is enabled by default. The Application Insights resource has the same name as your function app, and is created either in the same region or in the nearest region.
Require Microsoft Entra authentication
You can use the APPLICATIONINSIGHTS_AUTHENTICATION_STRING setting to enable connections to Application Insights using Microsoft Entra authentication. This creates a consistent authentication experience across all Application Insights pipelines, including Profiler and Snapshot Debugger, as well as from the Functions host and language-specific agents.
Note
There's no Entra authentication support for local development.
The value contains either Authorization=AAD for a system-assigned managed identity or ClientId=<YOUR_CLIENT_ID>;Authorization=AAD for a user-assigned managed identity. The managed identity must already be available to the function app, with an assigned role equivalent to Monitoring Metrics Publisher. For more information, see Microsoft Entra authentication for Application Insights.
The APPLICATIONINSIGHTS_CONNECTION_STRING setting is still required.
Note
When using APPLICATIONINSIGHTS_AUTHENTICATION_STRING to connect to Application Insights using Microsoft Entra authentication, you should also Disable local authentication for Application Insights. This configuration requires Microsoft Entra authentication in order for telemetry to be ingested into your workspace.
New function app in the portal
To review the Application Insights resource being created, select it to expand the Application Insights window. You can change the New resource name or select a different Location in an Azure geography where you want to store your data.
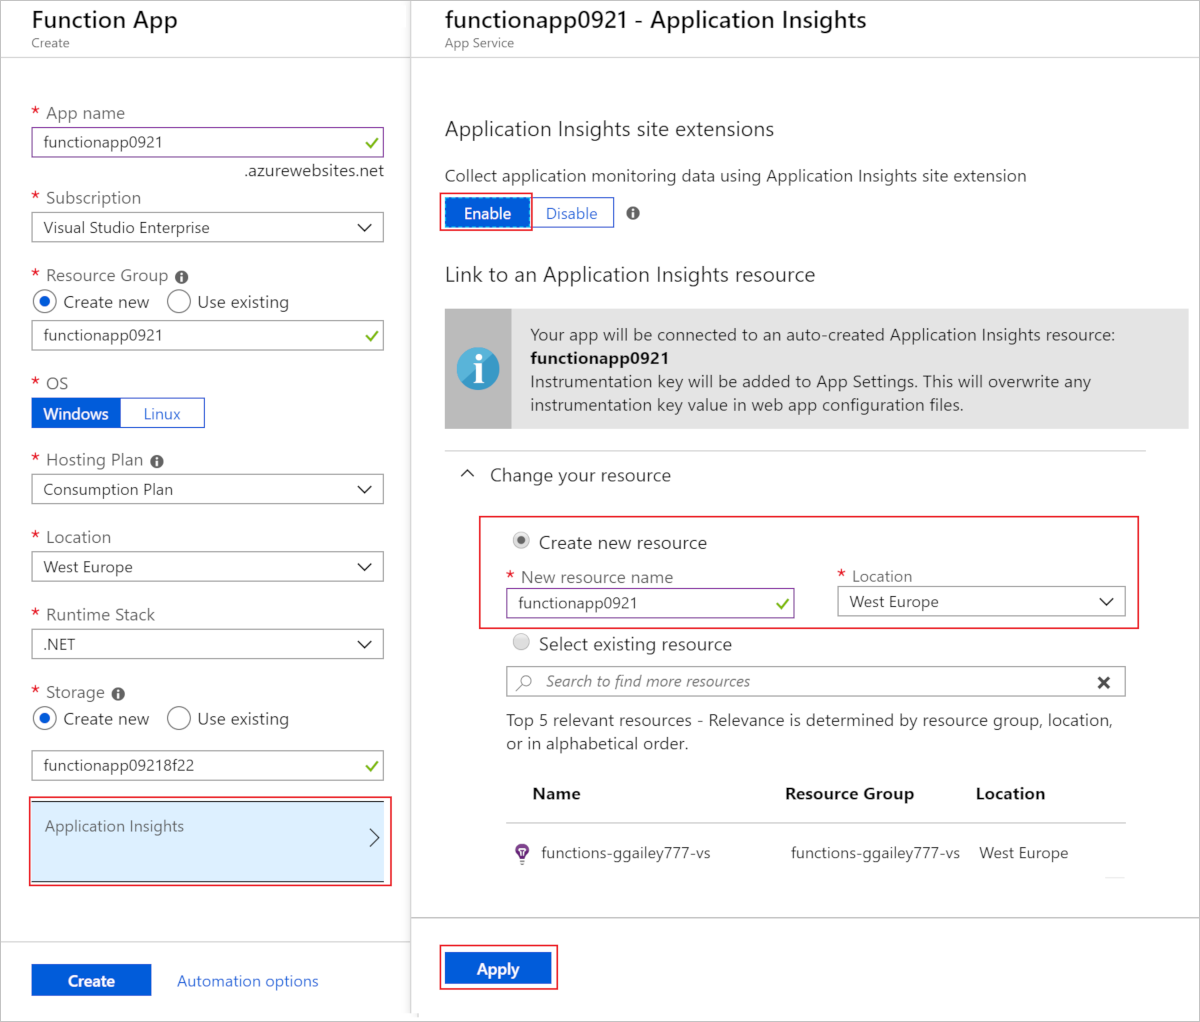
When you select Create, an Application Insights resource is created with your function app, which has the APPLICATIONINSIGHTS_CONNECTION_STRING set in application settings. Everything is ready to go.
Add to an existing function app
If an Application Insights resource wasn't created with your function app, use the following steps to create the resource. You can then add the connection string from that resource as an application setting in your function app.
In the Azure portal, search for and select function app, and then select your function app.
Select the Application Insights is not configured banner at the top of the window. If you don't see this banner, then your app might already have Application Insights enabled.
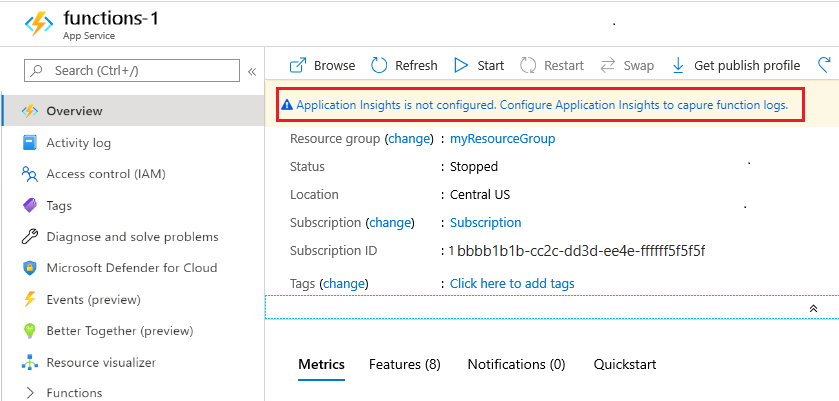
Expand Change your resource and create an Application Insights resource by using the settings specified in the following table:
Setting Suggested value Description New resource name Unique app name It's easiest to use the same name as your function app, which must be unique in your subscription. Location West Europe If possible, use the same region as your function app, or the one that's close to that region. 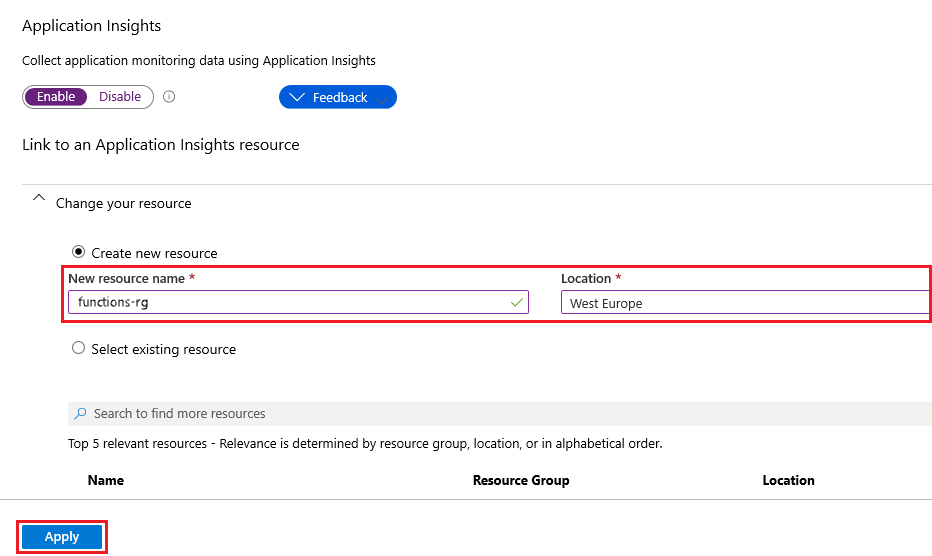
Select Apply.
The Application Insights resource is created in the same resource group and subscription as your function app. After the resource is created, close the Application Insights window.
In your function app, expand Settings, and then select Environment variables. In the App settings tab, if you see an app setting named
APPLICATIONINSIGHTS_CONNECTION_STRING, Application Insights integration is enabled for your function app running in Azure. If this setting doesn't exist, add it by using your Application Insights connection string as the value.
Note
Older function apps might use APPINSIGHTS_INSTRUMENTATIONKEY instead of APPLICATIONINSIGHTS_CONNECTION_STRING. When possible, update your app to use the connection string instead of the instrumentation key.
Disable built-in logging
Early versions of Functions used built-in monitoring, which is no longer recommended. When you enable Application Insights, disable the built-in logging that uses Azure Storage. The built-in logging is useful for testing with light workloads, but isn't intended for high-load production use. For production monitoring, we recommend Application Insights. If you use built-in logging in production, the logging record might be incomplete because of throttling on Azure Storage.
To disable built-in logging, delete the AzureWebJobsDashboard app setting. For more information about how to delete app settings in the Azure portal, see the Application settings section of How to manage a function app. Before you delete the app setting, ensure that no existing functions in the same function app use the setting for Azure Storage triggers or bindings.
Solutions with high volume of telemetry
Function apps are an essential part of solutions that can cause high volumes of telemetry, such as IoT solutions, rapid event driven solutions, high load financial systems, and integration systems. In this case, you should consider extra configuration to reduce costs while maintaining observability.
The generated telemetry can be consumed in real-time dashboards, alerting, detailed diagnostics, and so on. Depending on how the generated telemetry is consumed, you need to define a strategy to reduce the volume of data generated. This strategy allows you to properly monitor, operate, and diagnose your function apps in production. Consider the following options:
Use sampling: As mentioned previously, sampling helps to dramatically reduce the volume of telemetry events ingested while maintaining a statistically correct analysis. It could happen that even using sampling you still get a high volume of telemetry. Inspect the options that adaptive sampling provides to you. For example, set the
maxTelemetryItemsPerSecondto a value that balances the volume generated with your monitoring needs. Keep in mind that the telemetry sampling is applied per host executing your function app.Default log level: Use
WarningorErroras the default value for all telemetry categories. Later, you can decide which categories you want to set at theInformationlevel, so that you can monitor and diagnose your functions properly.Tune your functions telemetry: With the default log level set to
ErrororWarning, no detailed information from each function is gathered (dependencies, custom metrics, custom events, and traces). For those functions that are key for production monitoring, define an explicit entry for theFunction.<YOUR_FUNCTION_NAME>category and set it toInformation, so that you can gather detailed information. To avoid gathering user-generated logs at theInformationlevel, set theFunction.<YOUR_FUNCTION_NAME>.Usercategory to theErrororWarninglog level.Host.Aggregator category: As described in configure categories, this category provides aggregated information of function invocations. The information from this category is gathered in the Application Insights
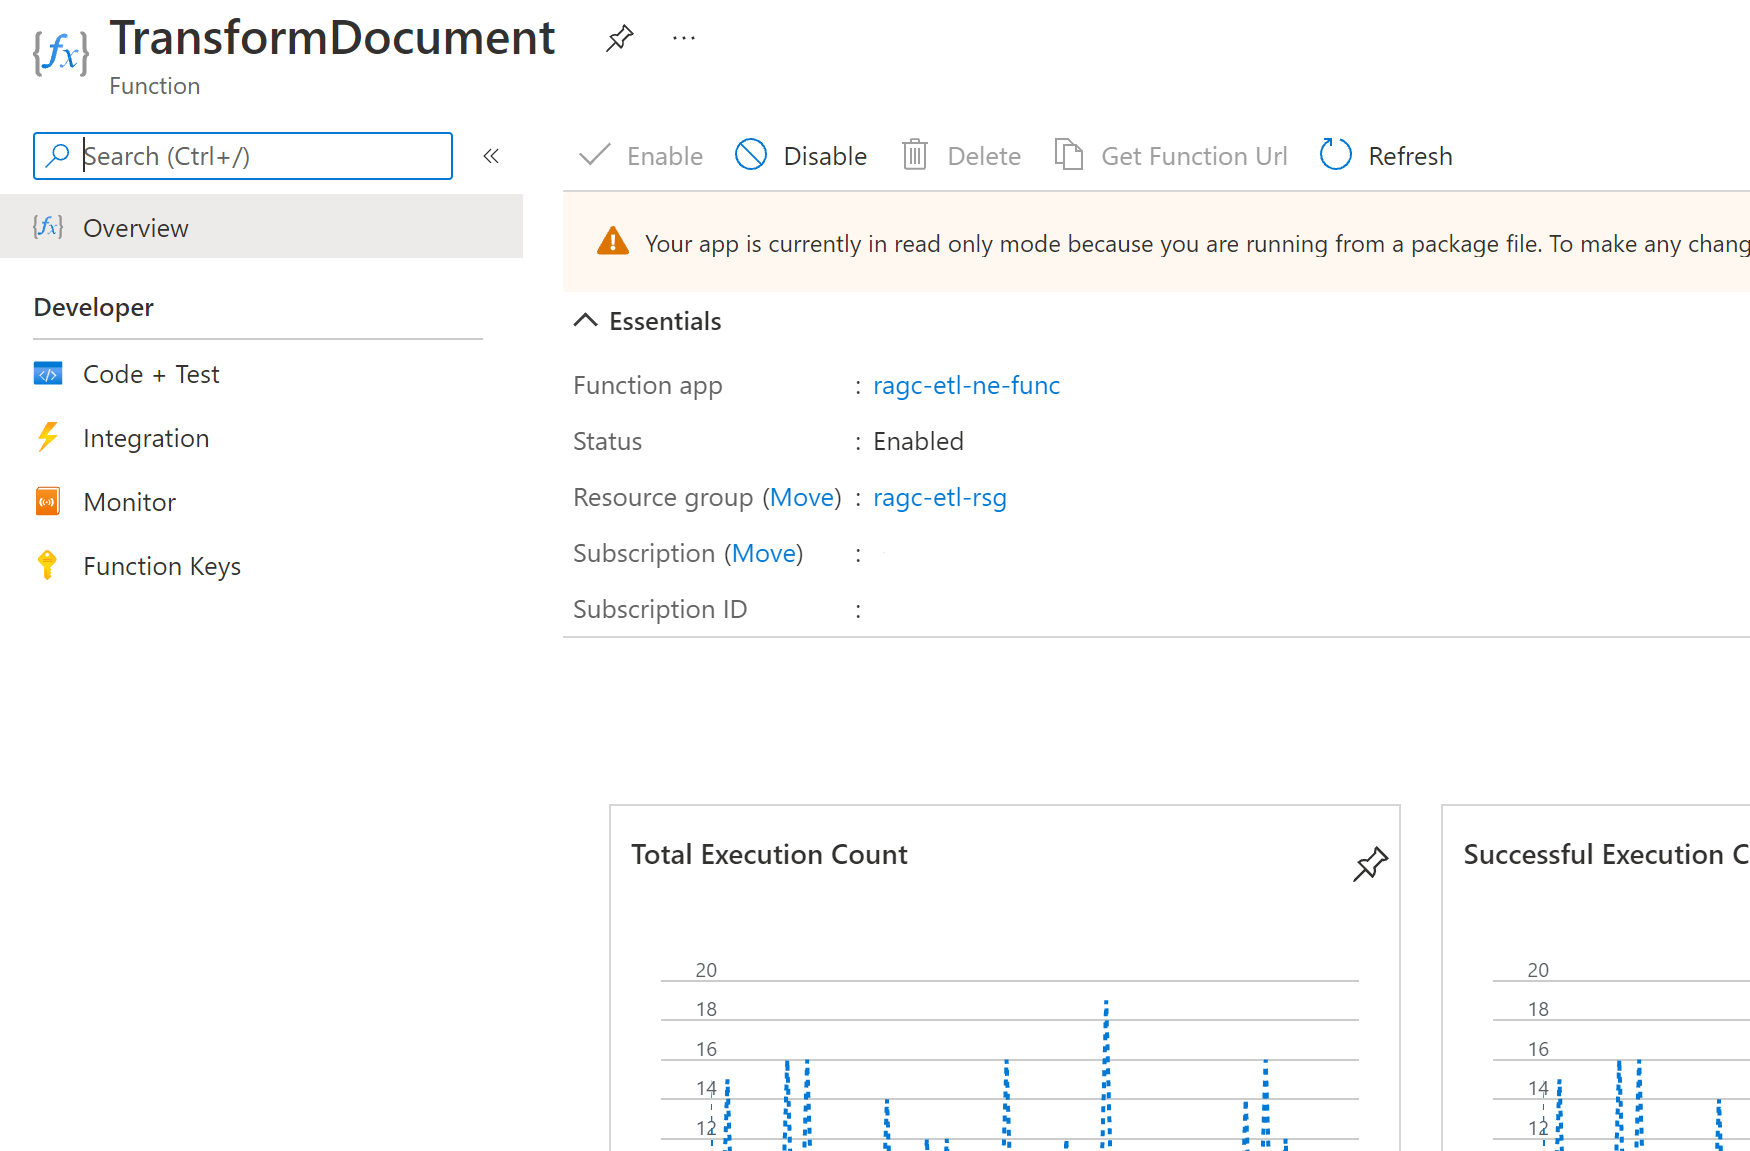
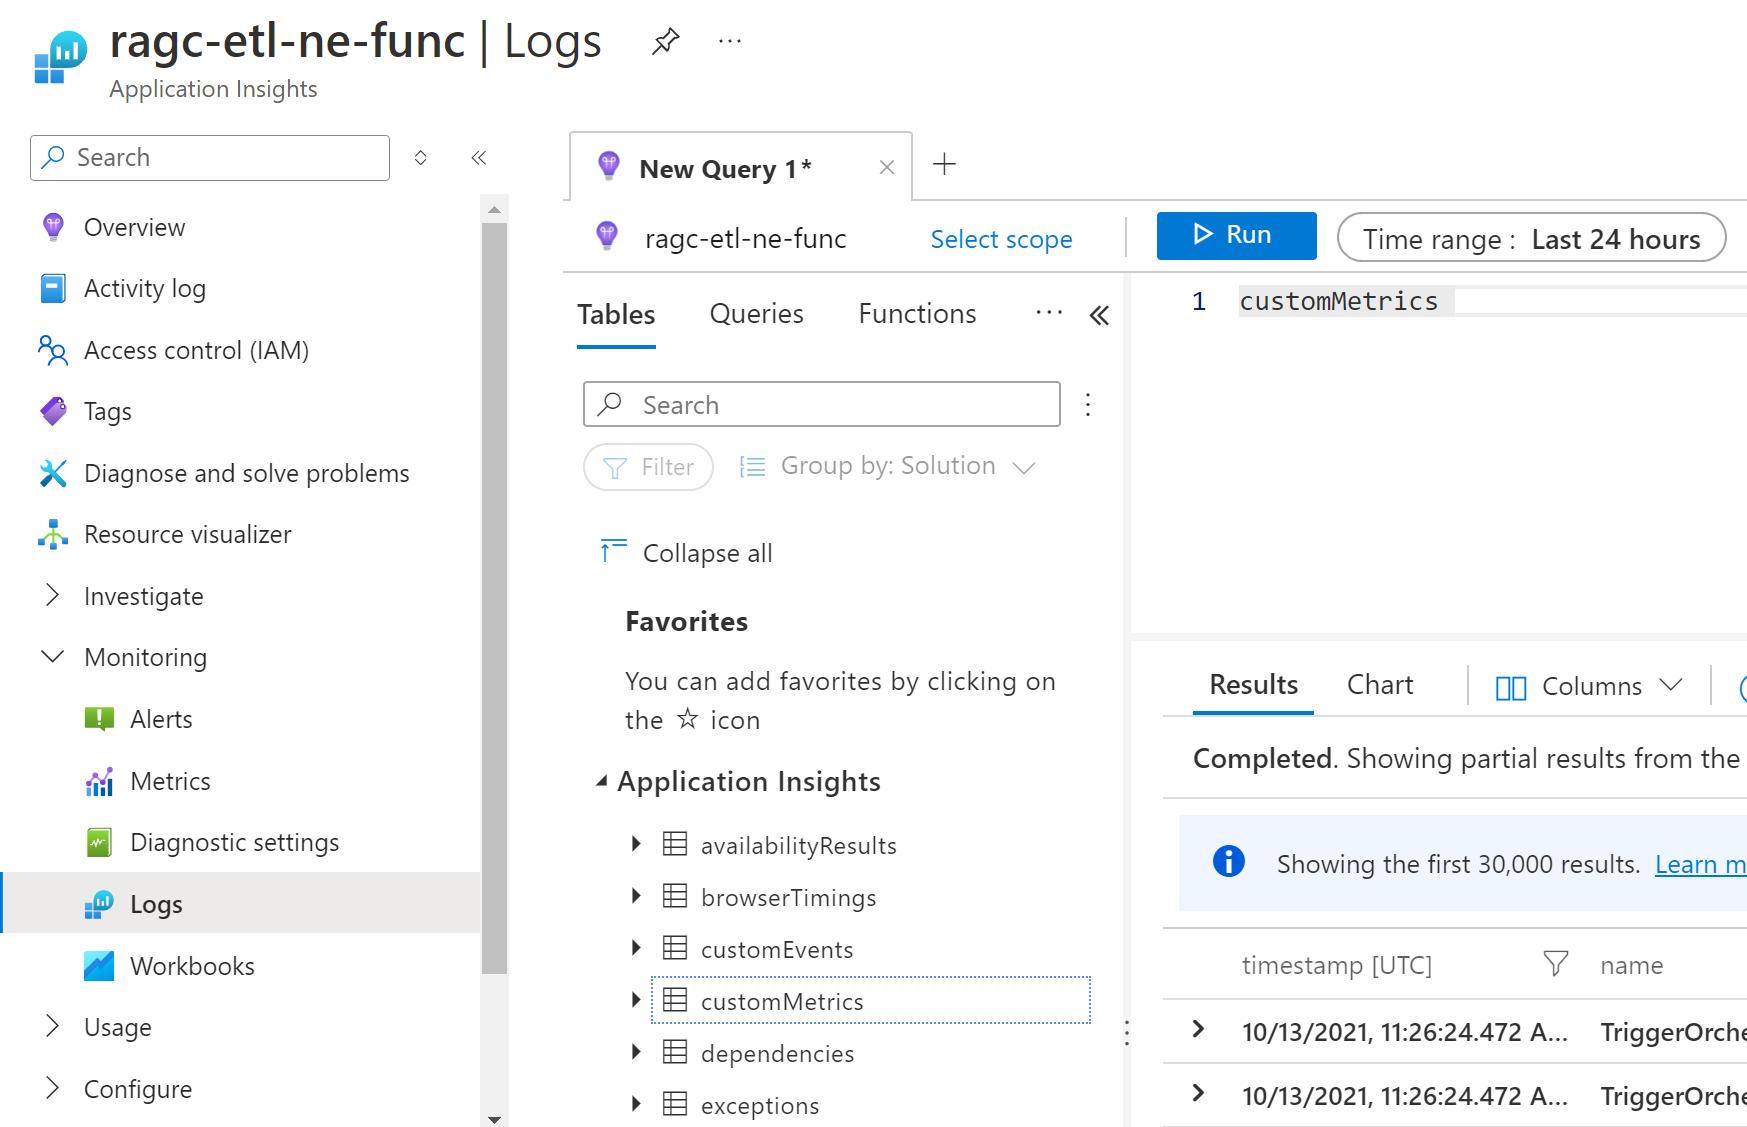
customMetricstable, and is shown in the function Overview tab in the Azure portal. Depending on how you configure the aggregator, consider that there can be a delay, determined by theflushTimeoutsetting, in the telemetry gathered. If you set this category to a value different fromInformation, you stop gathering the data in thecustomMetricstable and don't display metrics in the function Overview tab.The following screenshot shows
Host.Aggregatortelemetry data displayed in the function Overview tab:The following screenshot shows
Host.Aggregatortelemetry data in Application InsightscustomMetricstable:Host.Results category: As described in configure categories, this category provides the runtime-generated logs indicating the success or failure of a function invocation. The information from this category is gathered in the Application Insights
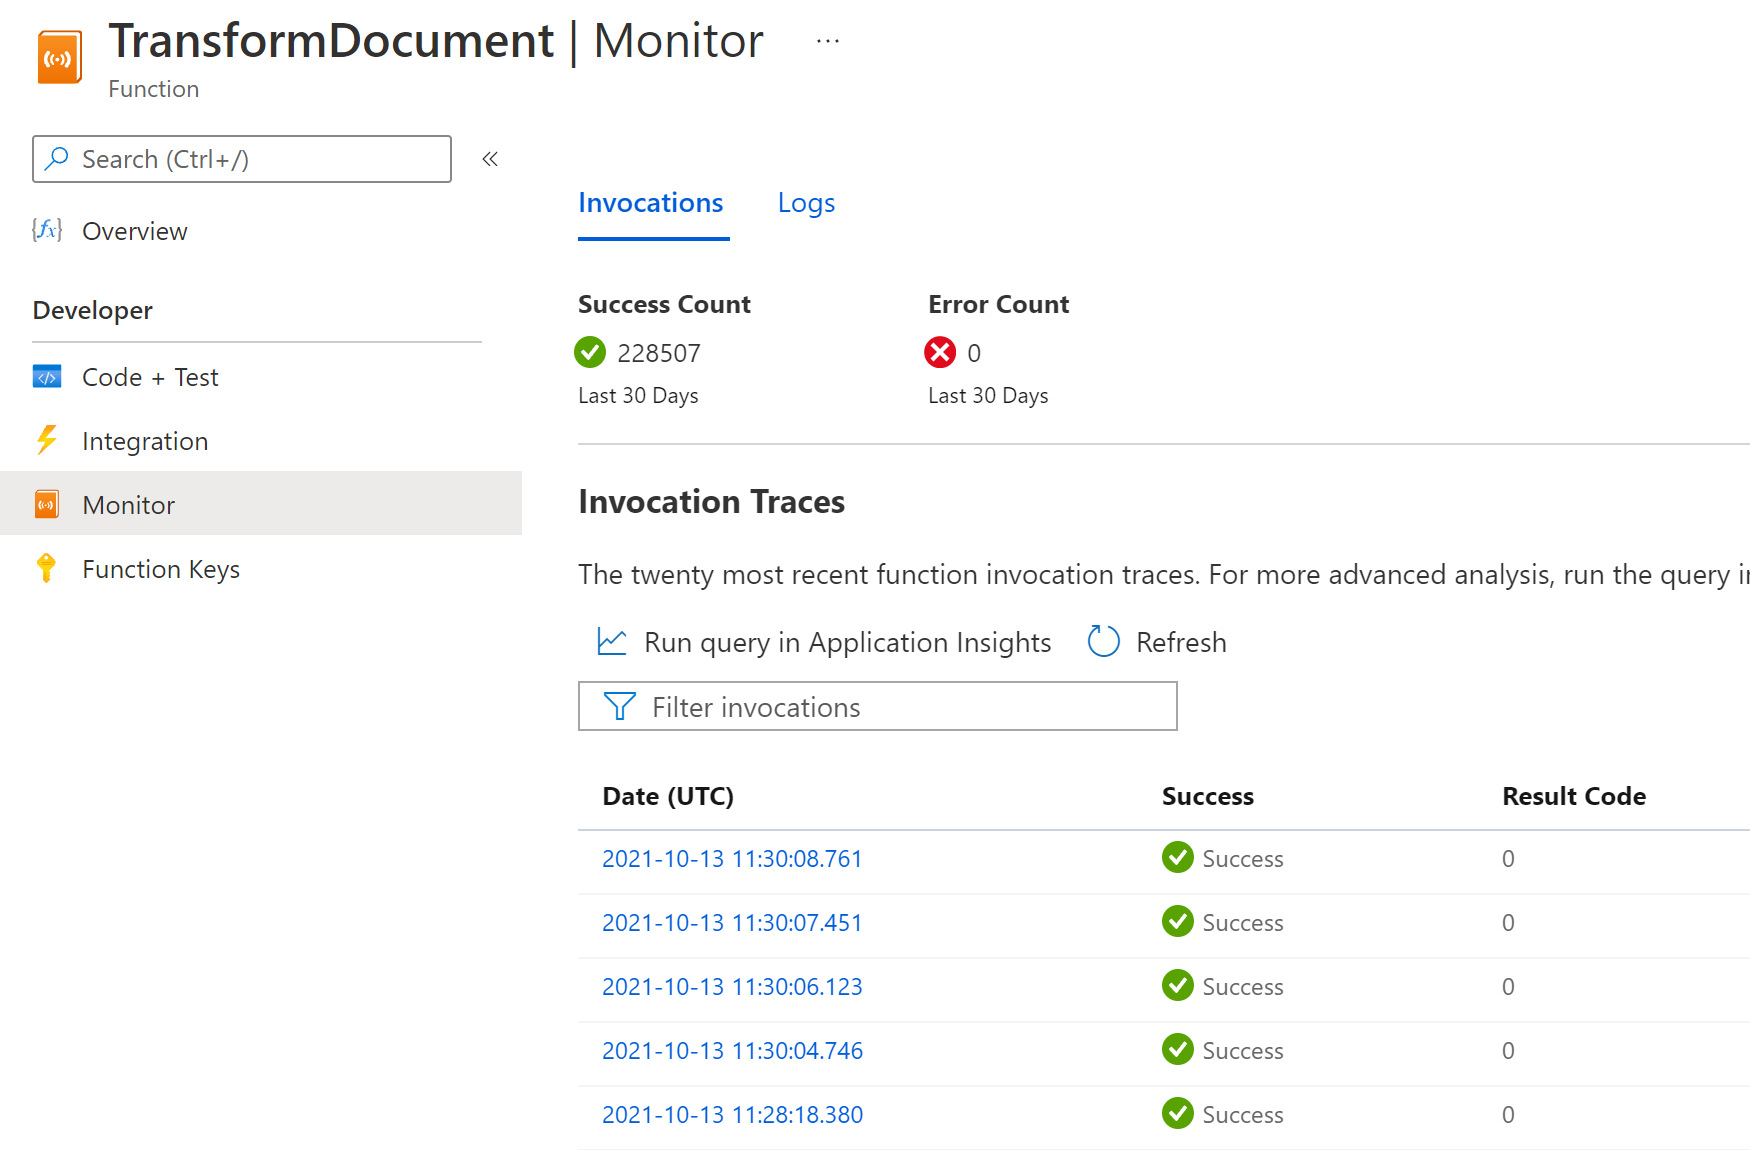
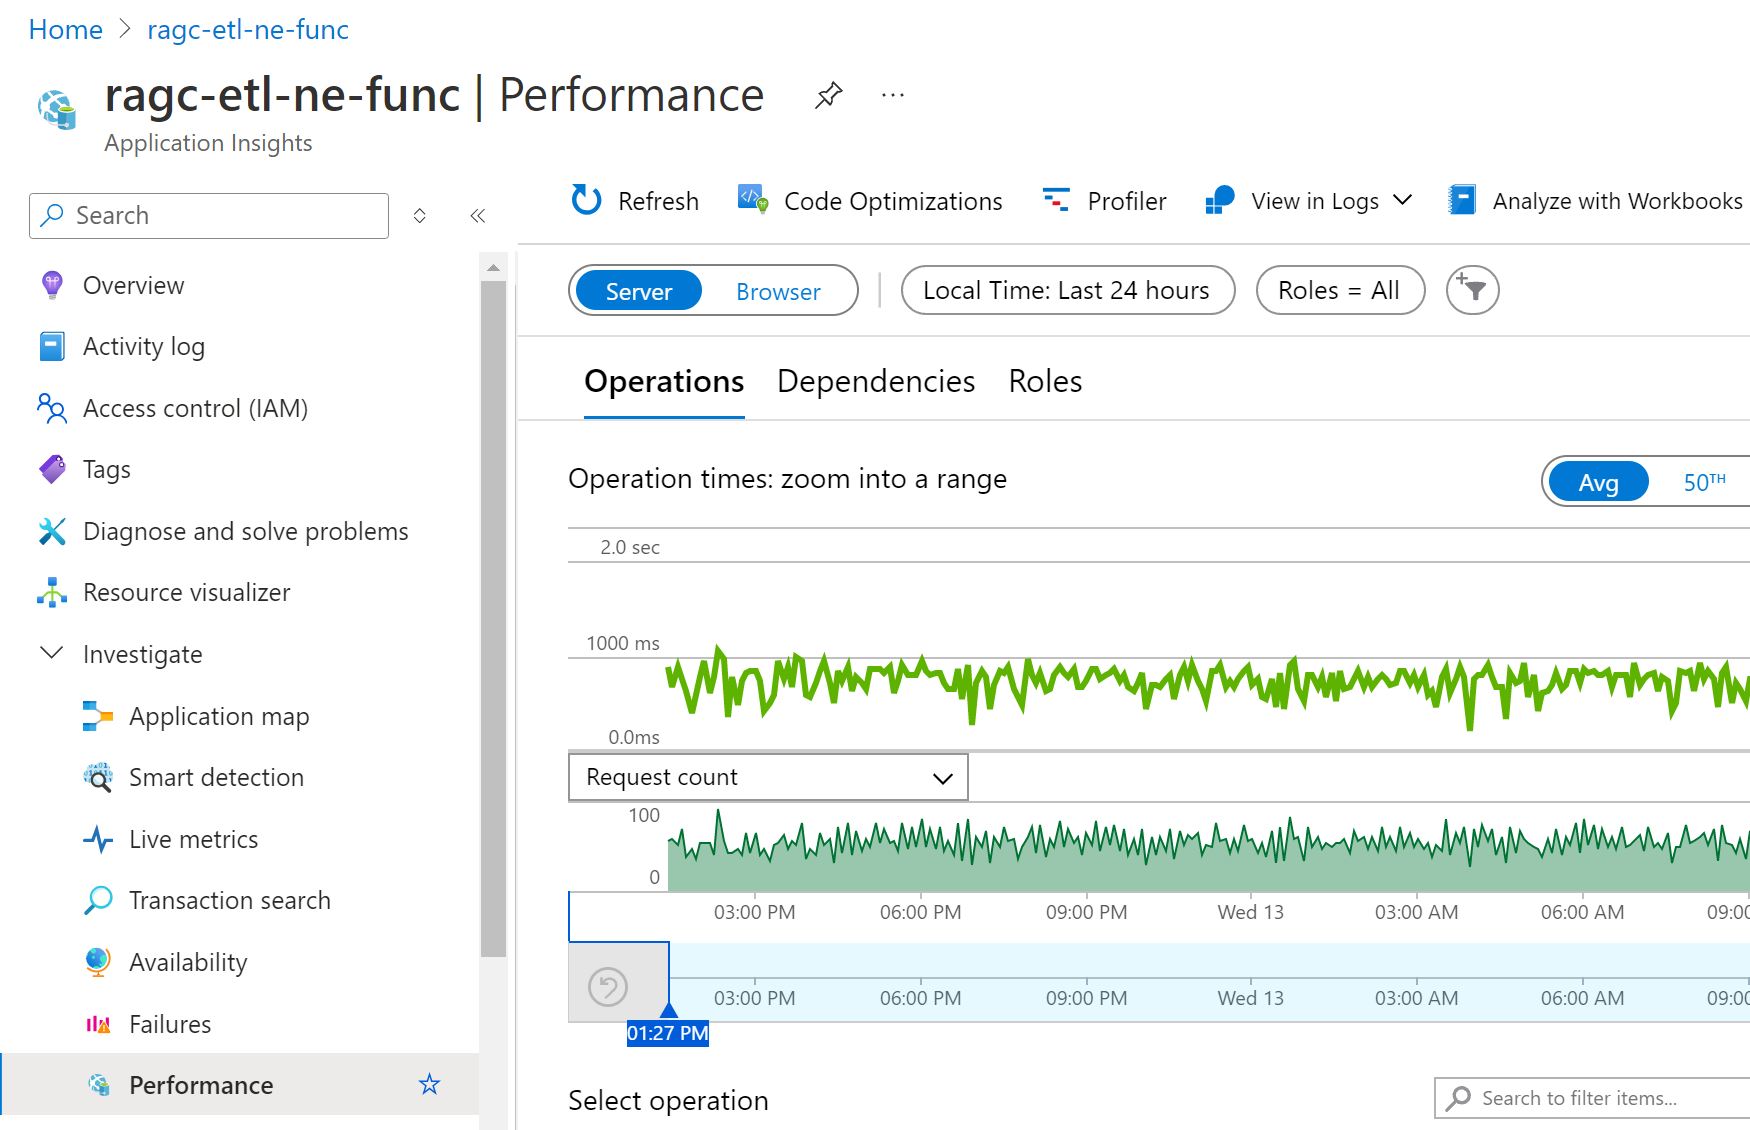
requeststable, and is shown in the function Monitor tab and in different Application Insights dashboards (Performance, Failures, and so on). If you set this category to a value different thanInformation, you gather only telemetry generated at the log level defined (or higher). For example, setting it toerrorresults in tracking requests data only for failed executions.The following screenshot shows the
Host.Resultstelemetry data displayed in the function Monitor tab:The following screenshot shows
Host.Resultstelemetry data displayed in Application Insights Performance dashboard:Host.Aggregator vs Host.Results: Both categories provide good insights about function executions. If needed, you can remove the detailed information from one of these categories, so that you can use the other for monitoring and alerting. Here's a sample:
{
  "version": "2.0",
  "logging": {
    "logLevel": {
      "default": "Warning",
      "Function": "Error",
      "Host.Aggregator": "Error",
      "Host.Results": "Information",
      "Function.Function1": "Information",
      "Function.Function1.User": "Error"
    },
    "applicationInsights": {
      "samplingSettings": {
        "isEnabled": true,
        "maxTelemetryItemsPerSecond": 1,
        "excludedTypes": "Exception"
      }
    }
  }
}
With this configuration:
The default value for all functions and telemetry categories is set to
Warning(including Microsoft and Worker categories). So, by default, all errors and warnings generated by runtime and custom logging are gathered.The
Functioncategory log level is set toError, so for all functions, by default, only exceptions and error logs are gathered. Dependencies, user-generated metrics, and user-generated events are skipped.For the
Host.Aggregatorcategory, as it's set to theErrorlog level, aggregated information from function invocations isn't gathered in thecustomMetricsApplication Insights table, and information about executions counts (total, successful, and failed) aren't shown in the function overview dashboard.For the
Host.Resultscategory, all the host execution information is gathered in therequestsApplication Insights table. All the invocations results are shown in the function Monitor dashboard and in Application Insights dashboards.For the function called
Function1, we set the log level toInformation. So, for this concrete function, all the telemetry is gathered (dependency, custom metrics, and custom events). For the same function, we set theFunction1.Usercategory (user-generated traces) toError, so only custom error logging is gathered.Note
Configuration per function isn't supported in v1.x of the Functions runtime.
Sampling is configured to send one telemetry item per second per type, excluding the exceptions. This sampling happens for each server host running our function app. So, if we have four instances, this configuration emits four telemetry items per second per type and all the exceptions that might occur.
Note
Metric counts such as request rate and exception rate are adjusted to compensate for the sampling rate, so that they show approximately correct values in Metric Explorer.
Tip
Experiment with different configurations to ensure that you cover your requirements for logging, monitoring, and alerting. Also, ensure that you have detailed diagnostics in case of unexpected errors or malfunctioning.
Overriding monitoring configuration at runtime
Finally, there could be situations where you need to quickly change the logging behavior of a certain category in production, and you don't want to make a whole deployment just for a change in the host.json file. For such cases, you can override the host.json values.
To configure these values at App settings level (and avoid redeployment on just host.json changes), you should override specific host.json values by creating an equivalent value as an application setting. When the runtime finds an application setting in the format AzureFunctionsJobHost__path__to__setting, it overrides the equivalent host.json setting located at path.to.setting in the JSON. When expressed as an application setting, a double underscore (__) replaces the dot (.) used to indicate JSON hierarchy. For example, you can use the following app settings to configure individual function log levels in host.json.
| Host.json path | App setting |
|---|---|
| logging.logLevel.default | AzureFunctionsJobHost__logging__logLevel__default |
| logging.logLevel.Host.Aggregator | AzureFunctionsJobHost__logging__logLevel__Host.Aggregator |
| logging.logLevel.Function | AzureFunctionsJobHost__logging__logLevel__Function |
| logging.logLevel.Function.Function1 | AzureFunctionsJobHost__logging__logLevel__Function.Function1 |
| logging.logLevel.Function.Function1.User | AzureFunctionsJobHost__logging__logLevel__Function.Function1.User |
You can override the settings directly at the Azure portal Function App Configuration pane or by using an Azure CLI or PowerShell script.
az functionapp config appsettings set --name MyFunctionApp --resource-group MyResourceGroup --settings "AzureFunctionsJobHost__logging__logLevel__Host.Aggregator=Information"
Note
Overriding the host.json through changing app settings will restart your function app.
App settings that contain a period aren't supported when running on Linux in an Elastic Premium plan or a Dedicated (App Service) plan. In these hosting environments, you should continue to use the host.json file.
Monitor function apps using Health check
You can use the Health Check feature to monitor function apps on the Premium (Elastic Premium) and Dedicated (App Service) plans. Health check isn't an option for the Consumption plan. To learn how to configure it, see Monitor App Service instances using Health check. Your function app should have an HTTP trigger function that responds with an HTTP status code of 200 on the same endpoint as configured on the Path parameter of the health check. You can also have that function perform extra checks to ensure that dependent services are reachable and working.
Related content
For more information about monitoring, see:
