Monitor GitOps (Flux v2) status and activity
To monitor status and activity related to GitOps with Flux v2 in your Azure Arc-enabled Kubernetes clusters or Azure Kubernetes Service (AKS) clusters, you have several options:
- Use the Azure portal to monitor Flux configurations and resources on individual clusters.
- Use a Grafana dashboard to monitor deployment and compliance status.
- Use the Flux Control Plane and Flux Cluster Stats dashboards to monitor resource consumption and reconciliations.
- Enable Prometheus scraping from clusters and create your own dashboards using the data in Azure Monitor workspace.
- Create alerts on Azure Monitor using the data available through Prometheus scraping.
This topic describes some of the ways you can monitor your Flux activity and status.
Monitor Flux configurations in the Azure portal
After you create Flux configurations on your cluster, you can view status information in the Azure portal by navigating to a cluster and selecting GitOps.
View details on cluster compliance and objects
The Compliance state shows whether the current state of the cluster matches the desired state. Possible values:
- Compliant: The cluster's state matches the desired state.
- Pending: An updated desired state was detected, but that state isn't yet reconciled on the cluster.
- Not Compliant: The current state doesn't match the desired state.

To help debug reconciliation issues for a cluster, select Configuration objects. Here, you can view logs of each of the configuration objects that Flux creates for each Flux configuration. Select an object name to view its logs.

To view the Kubernetes objects that were created as a result of Flux configurations being applied, select Workloads in the Kubernetes resources section of the cluster's service menu. Here, you can view all details of any resources that were created on the cluster.
By default, you can filter by namespace and service name. You can also add any label filter that you may be using in your applications to help narrow down the search.
View Flux configuration state and details
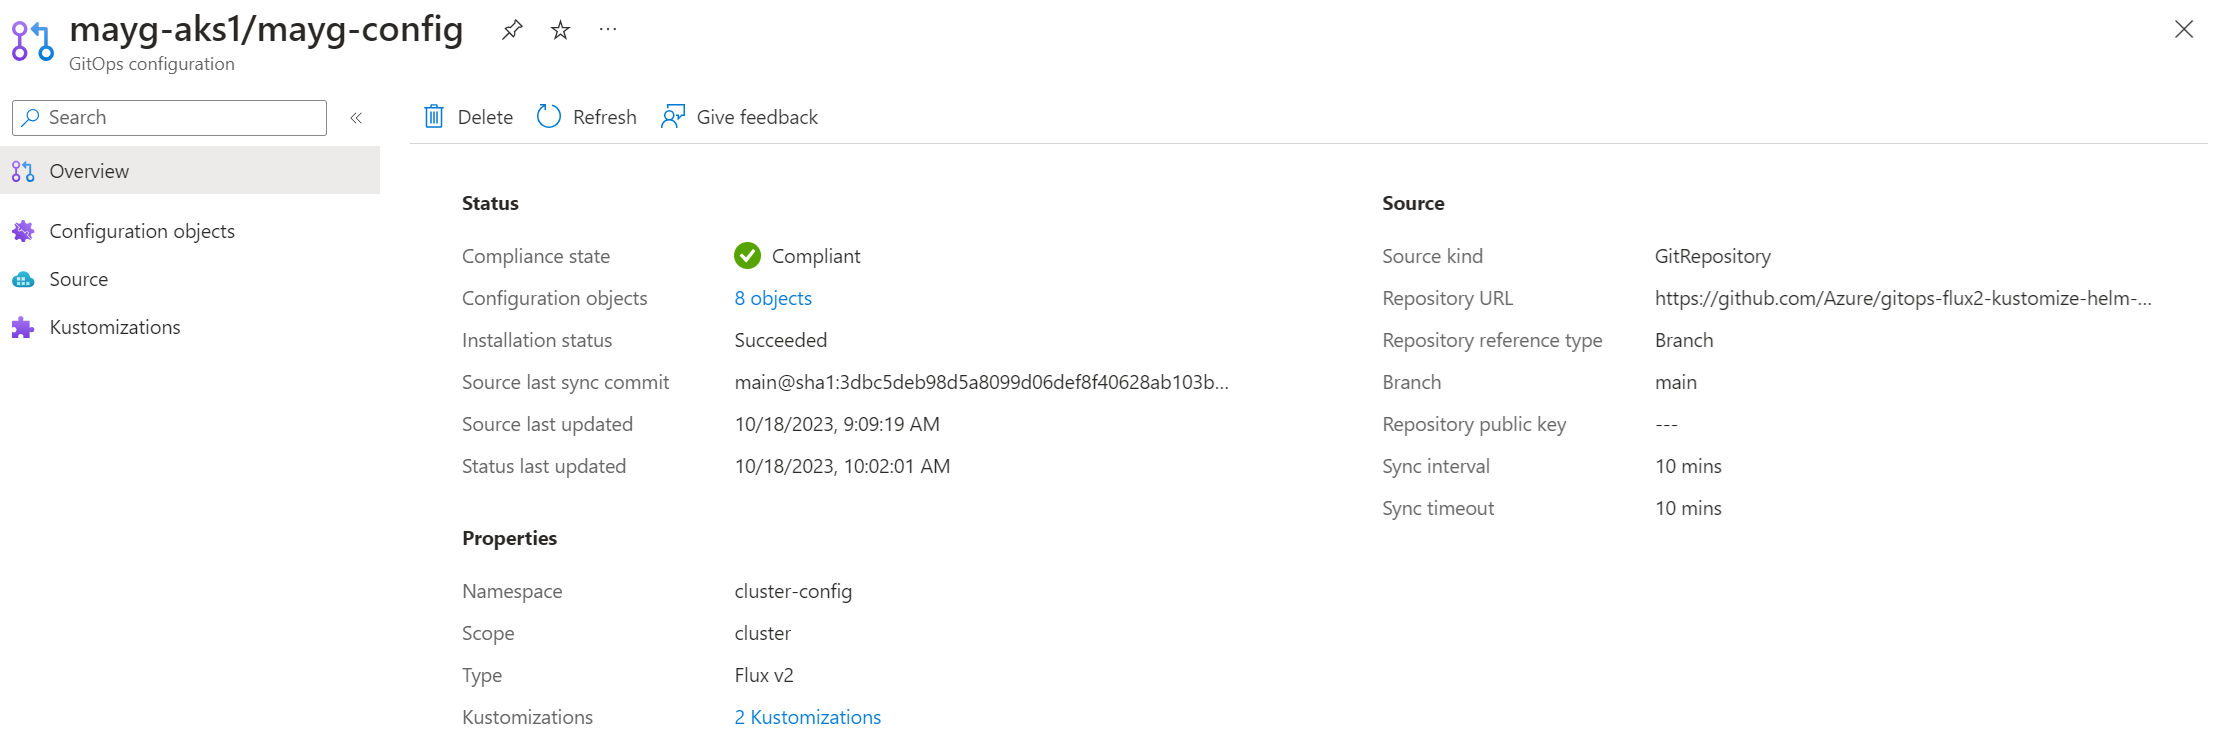
For each Flux configuration, the State column indicates whether the Flux configuration object was successfully created on the cluster.
Select any Flux configuration to see its Overview page, including the following information:
- Source commit ID for the last synchronization
- Timestamp of the latest source update
- Status update timestamp (indicating when the latest statistics were obtained)
- Repo URL and branch
- Links to view different kustomizations
Use dashboards to monitor GitOps status and activity
We provide dashboards to help you monitor status, compliance, resource consumption, and reconciliation activity for GitOps with Flux v2. These JSON dashboards can be imported to Grafana to help you view and analyze your data in real time. You can also set up alerts for this information.
To import and use these dashboards, you need:
- One or more existing Arc-enabled Kubernetes clusters or AKS clusters.
- The microsoft.flux extension installed on the clusters.
- At least one Flux configuration created on the clusters.
Monitor deployment and compliance status
Follow these steps to import dashboards that let you monitor Flux extension deployment and status across clusters, and the compliance status of Flux configuration on those clusters.
Note
These steps describe the process for importing the dashboard to Azure Managed Grafana. You can also import this dashboard to any Grafana instance. With this option, a service principal must be used; managed identity is not supported for data connection outside of Azure Managed Grafana.
Create an Azure Managed Grafana instance by using the Azure portal or Azure CLI. Ensure that you're able to access Grafana by selecting its endpoint on the Overview page. You need at least Grafana Editor level permissions to view and edit dashboards. You can check your access by going to Access control (IAM) on the Grafana instance.
If you're using a managed identity for the Azure Managed Grafana instance, follow these steps to assign it the Monitoring Reader role on the subscription where you created your Azure Managed Grafana instance:
- In the Azure portal, navigate to the subscription that you want to add.
- Select Access control (IAM).
- Select Add role assignment.
- Select the Monitoring Reader role, then select Next.
- On the Members tab, select Managed identity, then choose Select members.
- From the Managed identity list, select the subscription, then select Azure Managed Grafana and the name of your Azure Managed Grafana instance.
- Select Review + Assign.
If you're using a service principal, grant the Monitoring Reader role to the service principal that you'll use for your data source connection. Follow these same steps, but select User, group, or service principal in the Members tab, then select your service principal. (If you aren't using Azure Managed Grafana, you must use a service principal for data connection access.)
Create the Azure Monitor Data Source connection in your Azure Managed Grafana instance. This connection lets the dashboard access Azure Resource Graph data.
Download the GitOps Flux - Application Deployments Dashboard.
Follow the steps to import the JSON dashboard to Grafana.
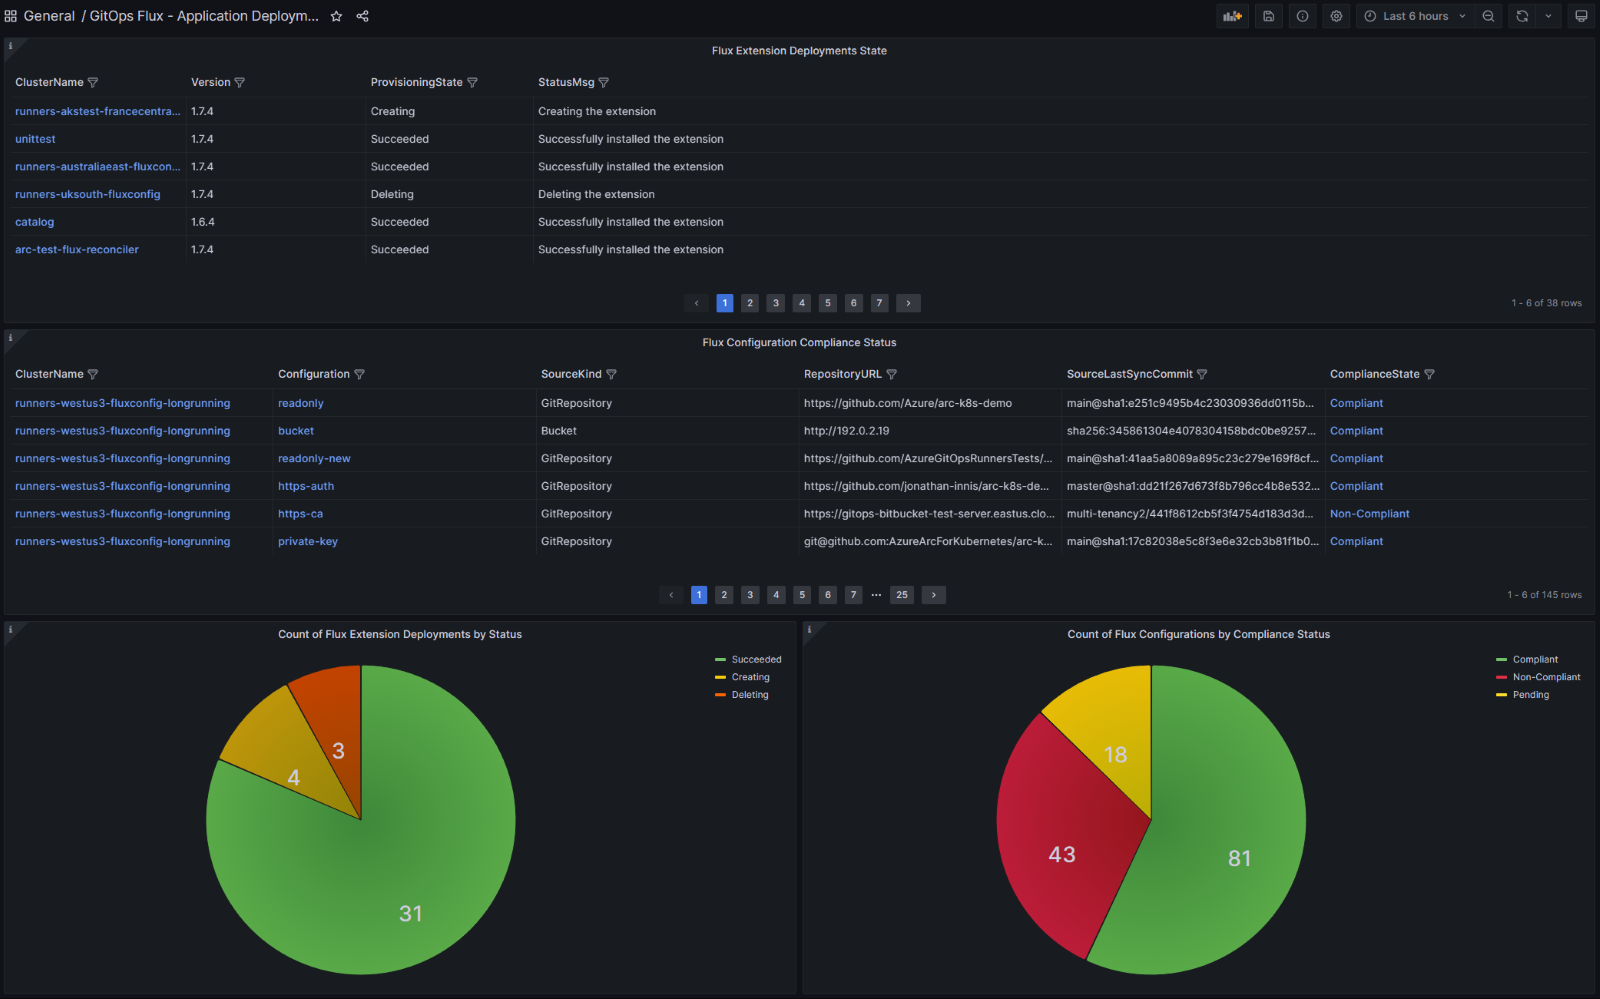
After you import the dashboard, it displays information from the clusters that you're monitoring, with several panels that provide details. For more details on an item, select the link to visit the Azure portal, where you can find information about configurations, errors and logs.
The Flux Extension Deployment Status table lists all clusters where the Flux extension is deployed, along with current deployment status.
The Flux Configuration Compliance Status table lists all Flux configurations created on the clusters, along with their compliance status. To see status and error logs for configuration objects such as Helm releases and kustomizations, select the Non-Compliant link from the ComplianceState column.
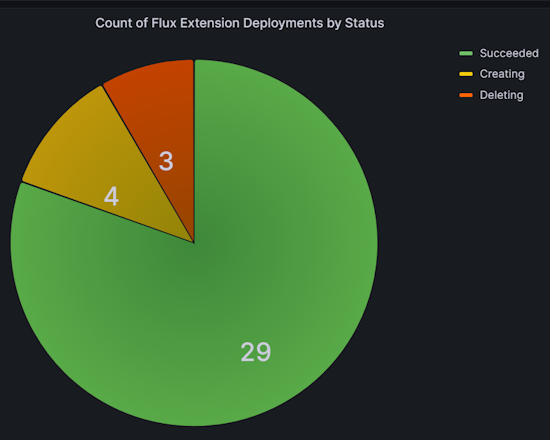
The Count of Flux Extension Deployments by Status chart shows the count of clusters, based on their provisioning state.
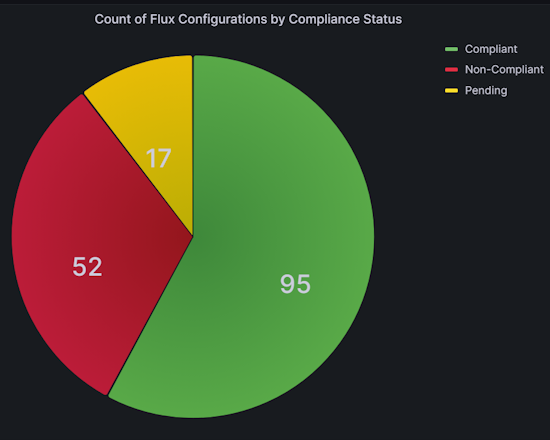
The Count of Flux Configurations by Compliance Status chart shows the count of Flux configurations, based on their compliance status with respect to the source repository.
Filter dashboard data to track application deployments
You can filter data in the GitOps Flux - Application Deployments Dashboard to change the information shown. For example, you can show data for only certain subscriptions or resource groups, or limit data to a particular cluster. To do so, select the filter option either from the top level dropdowns or from any column header in the tables.
For example, in the Flux Configuration Compliance Status table, you can select a specific commit from the SourceLastSyncCommit column. By doing so, you can track the status of a configuration deployment to all of the clusters affected by that commit.
Create alerts for extension and configuration failures
After you import the dashboard as described in the previous section, you can set up alerts. These alerts notify you when Flux extensions or Flux configurations experience failures.
Follow these steps to create an alert. Example queries are provided to detect extension provisioning or extension upgrade failures, or to detect compliance state failures.
In the left navigation menu of the dashboard, select Alerting.
Select Alert rules.
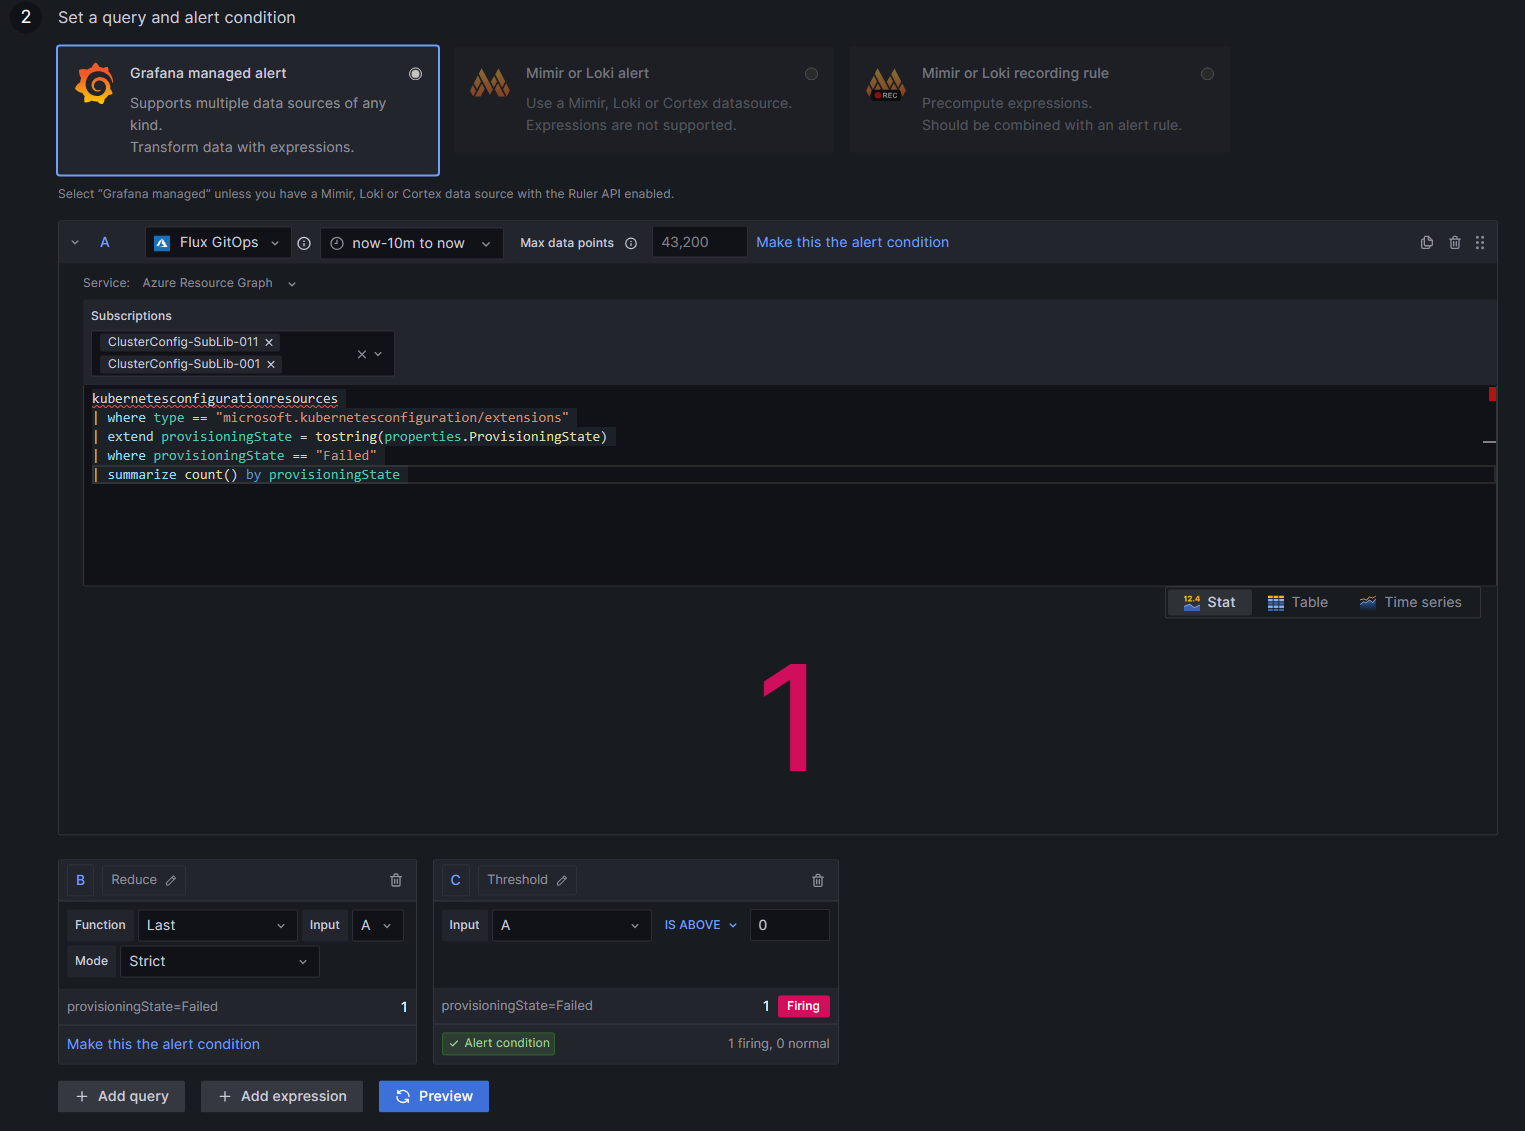
Select + Create alert rule. The new alert rule page opens, with the Grafana managed alerts option selected by default.
In Rule name, add a descriptive name. This name is displayed in the alert rule list, and it's used as the
alertnamelabel for every alert instance created from this rule.Under Set a query and alert condition:
Select a data source. The same data source used for the dashboard may be used here.
For Service, select Azure Resource Graph.
Select the subscriptions from the dropdown list.
Enter the query you want to use. For example, for extension provisioning or upgrade failures, you can enter this query:
kubernetesconfigurationresources
| where type == "microsoft.kubernetesconfiguration/extensions"
| extend provisioningState = tostring(properties.ProvisioningState)
| where provisioningState == "Failed"
| summarize count() by provisioningState
Or for compliance state failures, you can enter this query:
kubernetesconfigurationresources
| where type == "microsoft.kubernetesconfiguration/fluxconfigurations"
| extend complianceState=tostring(properties.complianceState)
| where complianceState == "Non-Compliant"
| summarize count() by complianceState
For Threshold box, select A for input type and set the threshold to 0 to receive alerts even if just one extension fails on the cluster. Mark this as the Alert condition.
Specify the alert evaluation interval:
- For Condition, select the query or expression to trigger the alert rule.
- For Evaluate every, enter the evaluation frequency as a multiple of 10 seconds.
- For Evaluate for, specify how long the condition must be true before the alert is created.
- In Configure no data and error handling, indicate what should happen when the alert rule returns no data or returns an error.
- To check the results from running the query, select Preview.
Add the storage location, rule group, and any other metadata that you want to associate with the rule.
- For Folder, select the folder where the rule should be stored.
- For Group, specify a predefined group.
- If desired, add a description and summary to customize alert messages.
- Add Runbook URL, panel, dashboard, and alert IDs as needed.
If desired, add any custom labels. Then select Save.
You can also configure contact points and notification policies for your alerts.
Monitor resource consumption and reconciliations
Follow these steps to import dashboards that let you monitor Flux resource consumption, reconciliations, API requests, and reconciler status.
Follow the steps to create an Azure Monitor Workspace.
Create an Azure Managed Grafana instance by using the Azure portal or Azure CLI.
Enable Prometheus metrics collection on the AKS clusters and/or Arc-enabled Kubernetes clusters that you want to monitor.
Configure Azure Monitor Agent to scrape the Azure Managed Flux metrics by creating a configmap:
kind: ConfigMap
apiVersion: v1
data:
  schema-version:
      #string.used by agent to parse config. supported versions are {v1}. Configs with other schema versions will be rejected by the agent.
    v1
  config-version:
    #string.used by customer to keep track of this config file's version in their source control/repository (max allowed 10 chars, other chars will be truncated)
    ver1
  default-scrape-settings-enabled: |-
    kubelet = true
    coredns = false
    cadvisor = true
    kubeproxy = false
    apiserver = false
    kubestate = true
    nodeexporter = true
    windowsexporter = false
    windowskubeproxy = false
    kappiebasic = true
    prometheuscollectorhealth = false
  # Regex for which namespaces to scrape through pod annotation based scraping.
  # This is none by default. Use '.*' to scrape all namespaces of annotated pods.
  pod-annotation-based-scraping: |-
    podannotationnamespaceregex = "flux-system"
  default-targets-scrape-interval-settings: |-
    kubelet = "30s"
    coredns = "30s"
    cadvisor = "30s"
    kubeproxy = "30s"
    apiserver = "30s"
    kubestate = "30s"
    nodeexporter = "30s"
    windowsexporter = "30s"
    windowskubeproxy = "30s"
    kappiebasic = "30s"
    prometheuscollectorhealth = "30s"
    podannotations = "30s"
metadata:
  name: ama-metrics-settings-configmap
  namespace: kube-system
Download the Flux Control Plane and Flux Cluster Stats dashboards.
Link the Managed Prometheus workspace to the Managed Grafana instance. This process takes a few minutes to complete.
Follow the steps to import these JSON dashboards to Grafana.
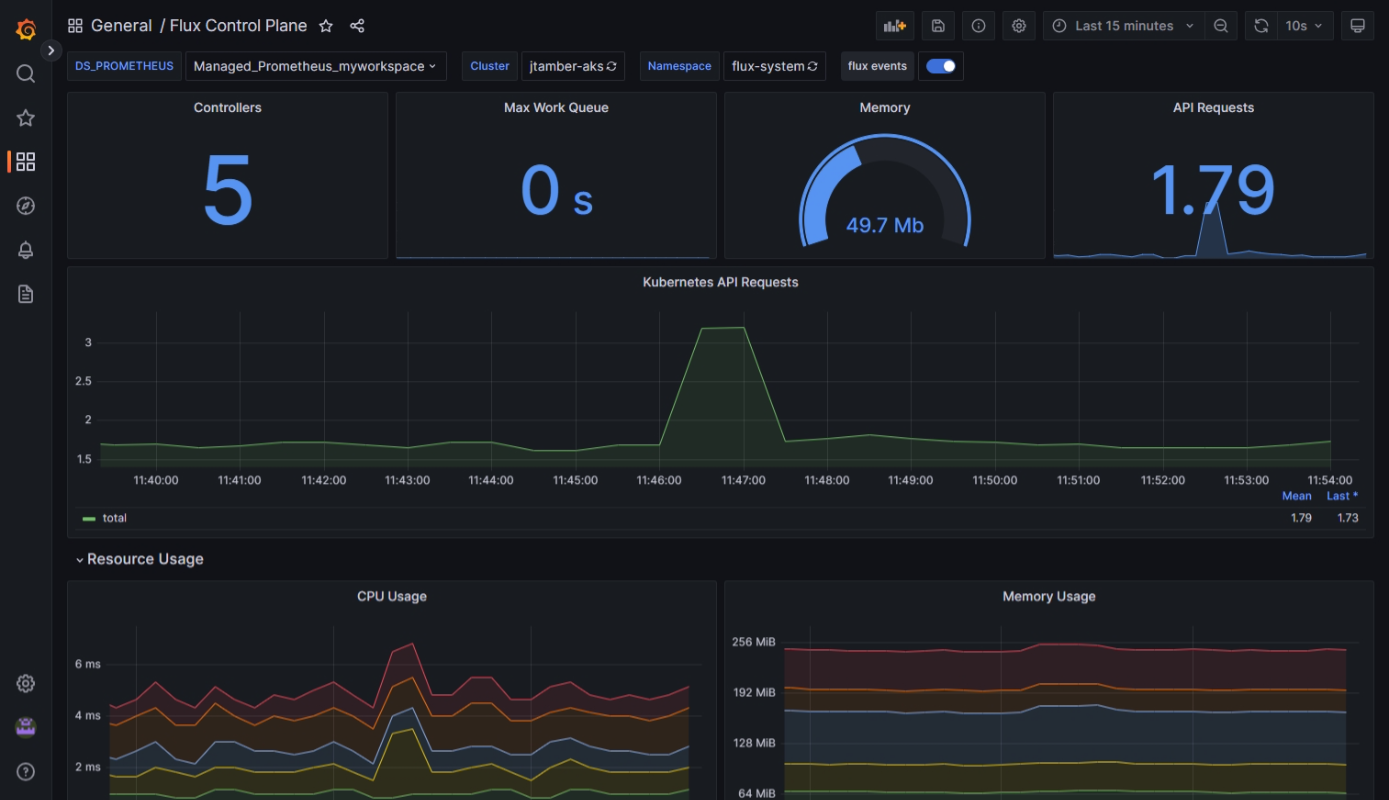
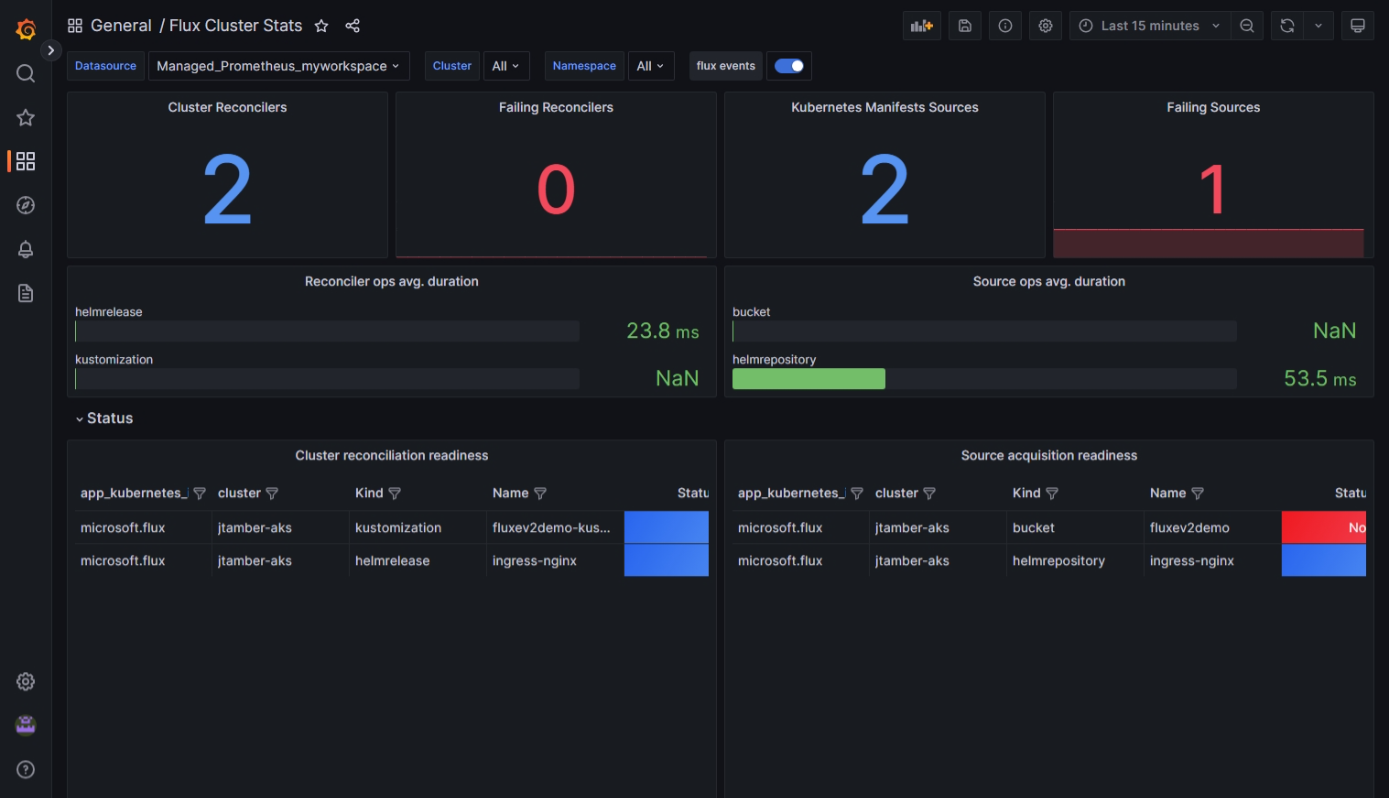
After you import the dashboards, they display information from the clusters that you're monitoring. To show information only for a particular cluster or namespace, use the filters near the top of each dashboard.
The Flux Control Plane dashboard shows details about status resource consumption, reconciliations at the cluster level, and Kubernetes API requests.
The Flux Cluster Stats dashboard shows details about the number of reconcilers, along with the status and execution duration of each reconciler.
Create alerts for resource consumption and reconciliation issues
After you import the dashboard as described in the previous section, you can set up alerts. These alerts notify you of resource consumption and reconciliation issues that may require attention.
To enable these alerts, you deploy a Bicep template similar to the one shown here. The alert rules in this template are samples that can be modified as needed.
After you download the Bicep template and make your changes, follow these steps to deploy the template.
param azureMonitorWorkspaceName string
param alertReceiverEmailAddress string

param kustomizationLookbackPeriodInMinutes int = 5
param helmReleaseLookbackPeriodInMinutes int = 5
param gitRepositoryLookbackPeriodInMinutes int = 5
param bucketLookbackPeriodInMinutes int = 5
param helmRepoLookbackPeriodInMinutes int = 5
param timeToResolveAlerts string = 'PT10M'
param location string = resourceGroup().location

resource azureMonitorWorkspace 'Microsoft.Monitor/accounts@2023-04-03' = {
  name: azureMonitorWorkspaceName
  location: location
}

resource fluxRuleActionGroup 'Microsoft.Insights/actionGroups@2023-01-01' = {
  name: 'fluxRuleActionGroup'
  location: 'global'
  properties: {
    enabled: true
    groupShortName: 'fluxGroup'
    emailReceivers: [
      {
        name: 'emailReceiver'
        emailAddress: alertReceiverEmailAddress
      }
    ]
  }
}

resource fluxRuleGroup 'Microsoft.AlertsManagement/prometheusRuleGroups@2023-03-01' = {
  name: 'fluxRuleGroup'
  location: location
  properties: {
    description: 'Flux Prometheus Rule Group'
    scopes: [
      azureMonitorWorkspace.id
    ]
    enabled: true
    interval: 'PT1M'
    rules: [
      {
        alert: 'KustomizationNotReady'
        expression: 'sum by (cluster, namespace, name) (gotk_reconcile_condition{type="Ready", status="False", kind="Kustomization"}) > 0'
        for: 'PT${kustomizationLookbackPeriodInMinutes}M'
        labels: {
          description: 'Kustomization reconciliation failing for last ${kustomizationLookbackPeriodInMinutes} minutes.'
        }
        annotations: {
          description: 'Kustomization reconciliation failing for last ${kustomizationLookbackPeriodInMinutes} minutes.'
        }
        enabled: true
        severity: 3
        resolveConfiguration: {
          autoResolved: true
          timeToResolve: timeToResolveAlerts
        }
        actions: [
          {
            actionGroupId: fluxRuleActionGroup.id
          }
        ]
      }
      {
        alert: 'HelmReleaseNotReady'
        expression: 'sum by (cluster, namespace, name) (gotk_reconcile_condition{type="Ready", status="False", kind="HelmRelease"}) > 0'
        for: 'PT${helmReleaseLookbackPeriodInMinutes}M'
        labels: {
          description: 'HelmRelease reconciliation failing for last ${helmReleaseLookbackPeriodInMinutes} minutes.'
        }
        annotations: {
          description: 'HelmRelease reconciliation failing for last ${helmReleaseLookbackPeriodInMinutes} minutes.'
        }
        enabled: true
        severity: 3
        resolveConfiguration: {
          autoResolved: true
          timeToResolve: timeToResolveAlerts
        }
        actions: [
          {
            actionGroupId: fluxRuleActionGroup.id
          }
        ]
      }
      {
        alert: 'GitRepositoryNotReady'
        expression: 'sum by (cluster, namespace, name) (gotk_reconcile_condition{type="Ready", status="False", kind="GitRepository"}) > 0'
        for: 'PT${gitRepositoryLookbackPeriodInMinutes}M'
        labels: {
          description: 'GitRepository reconciliation failing for last ${gitRepositoryLookbackPeriodInMinutes} minutes.'
        }
        annotations: {
          description: 'GitRepository reconciliation failing for last ${gitRepositoryLookbackPeriodInMinutes} minutes.'
        }
        enabled: true
        severity: 3
        resolveConfiguration: {
          autoResolved: true
          timeToResolve: timeToResolveAlerts
        }
        actions: [
          {
            actionGroupId: fluxRuleActionGroup.id
          }
        ]
      }
      {
        alert: 'BucketNotReady'
        expression: 'sum by (cluster, namespace, name) (gotk_reconcile_condition{type="Ready", status="False", kind="Bucket"}) > 0'
        for: 'PT${bucketLookbackPeriodInMinutes}M'
        labels: {
          description: 'Bucket reconciliation failing for last ${bucketLookbackPeriodInMinutes} minutes.'
        }
        annotations: {
          description: 'Bucket reconciliation failing for last ${bucketLookbackPeriodInMinutes} minutes.'
        }
        enabled: true
        severity: 3
        resolveConfiguration: {
          autoResolved: true
          timeToResolve: timeToResolveAlerts
        }
        actions: [
          {
            actionGroupId: fluxRuleActionGroup.id
          }
        ]
      }
      {
        alert: 'HelmRepositoryNotReady'
        expression: 'sum by (cluster, namespace, name) (gotk_reconcile_condition{type="Ready", status="False", kind="HelmRepository"}) > 0'
        for: 'PT${helmRepoLookbackPeriodInMinutes}M'
        labels: {
          description: 'HelmRepository reconciliation failing for last ${helmRepoLookbackPeriodInMinutes} minutes.'
        }
        annotations: {
          description: 'HelmRepository reconciliation failing for last ${helmRepoLookbackPeriodInMinutes} minutes.'
        }
        enabled: true
        severity: 3
        resolveConfiguration: {
          autoResolved: true
          timeToResolve: timeToResolveAlerts
        }
        actions: [
          {
            actionGroupId: fluxRuleActionGroup.id
          }
        ]
      }
    ]
  }
}
Next steps
- Review our tutorial on using GitOps with Flux v2 to manage configuration and application deployment.
- Learn about Azure Monitor Container Insights.
