연습 - CPU 사용량이 높은 컴퓨터 식별
여기서는 테이블에서 데이터를 Perf 검색하고 변환하는 KQL 쿼리를 작성하여 총 컴퓨팅 용량에 도달했거나 가까운 컴퓨터와 사용 중인 컴퓨터를 파악합니다.
1. 목표 설정
성능 문제를 해결하고, 잠재적인 문제를 완화하고, 보다 효율적으로 운영할 기회를 식별하기 위해 IT 환경에서 가상 머신의 CPU(중앙 처리 장치) 사용을 분석하려고 합니다.
CPU 관련 성능 문제와 효율성을 높일 기회를 식별하려면 다음 정보가 필요합니다.
- 각 활성 컴퓨터의 CPU 사용량 추세.
- 최고 및 조용한 시간에 컴퓨터의 CPU 사용량.
2. 로그 평가
Windows 및 Linux 에이전트는 모니터링되는 컴퓨터에서 실행되는 하드웨어 구성 요소, 운영 체제 및 애플리케이션의 성능 카운터를 Azure Monitor의 Perf 테이블로 보냅니다.
Perf 테이블에서 간단한 쿼리를 실행하여 지난 24시간 동안의 로그를 검색하고 테이블 스키마와 테이블이 보유하는 데이터를 파악해 보겠습니다.
Log Analytics 데모 환경에서 쿼리를 실행하려면 클릭
Perf  // The table you’re querying
| where TimeGenerated > ago(1d) // Filters for entries generated in the past day

TimeGenerated, Computer, ObjectName, CounterName, InstanceName 및 CounterValue열에 분석과 관련된 데이터가 있는 것을 볼 수 있습니다.
ObjectName 열에는 Azure Monitor가 모니터링되는 컴퓨터에서 데이터를 수집하는 모든 개체의 이름이 나열됩니다. CounterName 열에는 Azure Monitor에서 수집하는 다양한 성능 카운터의 이름이 있습니다. 이 두 열 모두 많은 값을 보유하며, 그 중 많은 값이 여러 번 표시됩니다. 이러한 열의 고유 값을 명확하게 확인하고 현재 분석과 관련된 카운터를 확인하기 위해 다음 쿼리를 실행해 보겠습니다.
Log Analytics 데모 환경에서 쿼리를 실행하려면 클릭
Perf // The table you’re querying
| distinct ObjectName,CounterName // Lists distinct combinations of ObjectName and CounterName values
이 스크린샷은 지난 24시간 동안의 CounterName열에 있는 ObjectName 및 CounterName 값의 고유한 조합을 보여줍니다.

% Processor Time 카운터를 사용하면 프로세서 또는 CPU(중앙 처리 장치)의 사용률을 이해할 수 있습니다. 이것은 필요한 정보입니다.
이 데이터를 사용하는 방법과 데이터를 추출하고 변환하는 데 도움이 되는 KQL 작업을 평가해 보겠습니다.
| 열 | 설명 | 분석 목표 | 관련 KQL 작업 |
|---|---|---|---|
TimeGenerated |
가상 머신이 각 로그를 생성한 시기를 나타냅니다. | 분석의 시간 범위를 정의합니다. | where TimeGenerated > ago(1d) 자세한 내용은 ago(), where 연산자 및 숫자 연산자를 참조하세요. |
Computer |
이벤트가 수집된 컴퓨터. | CPU 사용량을 특정 컴퓨터와 연결합니다. | summarize... by Computer 자세한 내용은 summarize 연산자를 참조하세요. |
ObjectName |
테이블이 성능 데이터를 보유하는 모든 개체의 이름을 보유합니다. | 프로세서의 성능을 모니터링합니다. | where ObjectName == "Processor" 자세한 내용은 ==(equals) 연산자를 참조하세요. |
CounterName |
테이블에 있는 모든 성능 카운터의 이름을 보유합니다. | % Processor Time 성능 카운터를 모니터링합니다. |
where CounterName == "% Processor Time" 자세한 내용은 where 연산자 및 ==(equals) 연산자를 참조하세요. |
InstanceName |
모니터링되는 개체의 모니터링되는 인스턴스를 나열합니다. | 모든 프로세서 코어를 모니터링합니다. | where InstanceName == "_Total" 자세한 내용은 where 연산자 및 ==(equals) 연산자를 참조하세요. |
CounterValue |
카운터에 대해 수집된 측정값입니다. | % Processor Time 성능 카운터에 대한 성능 측정값을 검색합니다. |
summarize min(CounterValue), avg(CounterValue), max(CounterValue), percentiles(CounterValue, 90,99) 자세한 내용은 summarize 연산자 및 min(), max(), avg() 및 percentiles() 집계 함수를 참조하세요. |
3. 쿼리 작성
지난 날 동안 모든 컴퓨터의 평균, 최소 및 최대 CPU 사용량을 요약하는 쿼리를 작성합니다.
% Processor Time성능 카운터를 보고한 지난 날에 생성된 모든 로그를 검색합니다.Log Analytics 데모 환경에서 쿼리를 실행하려면 클릭.
Perf  // The table you’re querying
| where TimeGenerated > ago(1d) and ObjectName == "Processor" and CounterName == "% Processor Time" and InstanceName == "_Total" // Filters for entries generated in the past day related to total processor time measurements
이 쿼리는 지난 날의 총 프로세서 시간 측정과 관련된 모든 로그를 검색합니다.

최소, 최대 및 평균 카운터 값을 찾고 각 컴퓨터에 대한 90번째 및 99번째 백분위수 카운터 값을 계산합니다.
Log Analytics 데모 환경에서 쿼리를 실행하려면 클릭
Perf  // The table you’re querying
| where TimeGenerated > ago(1d) and ObjectName == "Processor" and CounterName == "% Processor Time" and InstanceName == "_Total" // Filters for entries generated in the past day related to total processor time measurements
| summarize min(CounterValue), avg(CounterValue), max(CounterValue), percentiles(CounterValue, 90,99) by Computer // Presents the minimum, maximum, average, 90th and 99th percentile counter values for each computer
이 쿼리의 결과 집합은 Log Analytics 작업 영역에 데이터가 있는 각 컴퓨터에 대한 최소, 최대, 평균, 90번째 및 99번째 백분위수
% Processor Time카운터 값을 보여줍니다.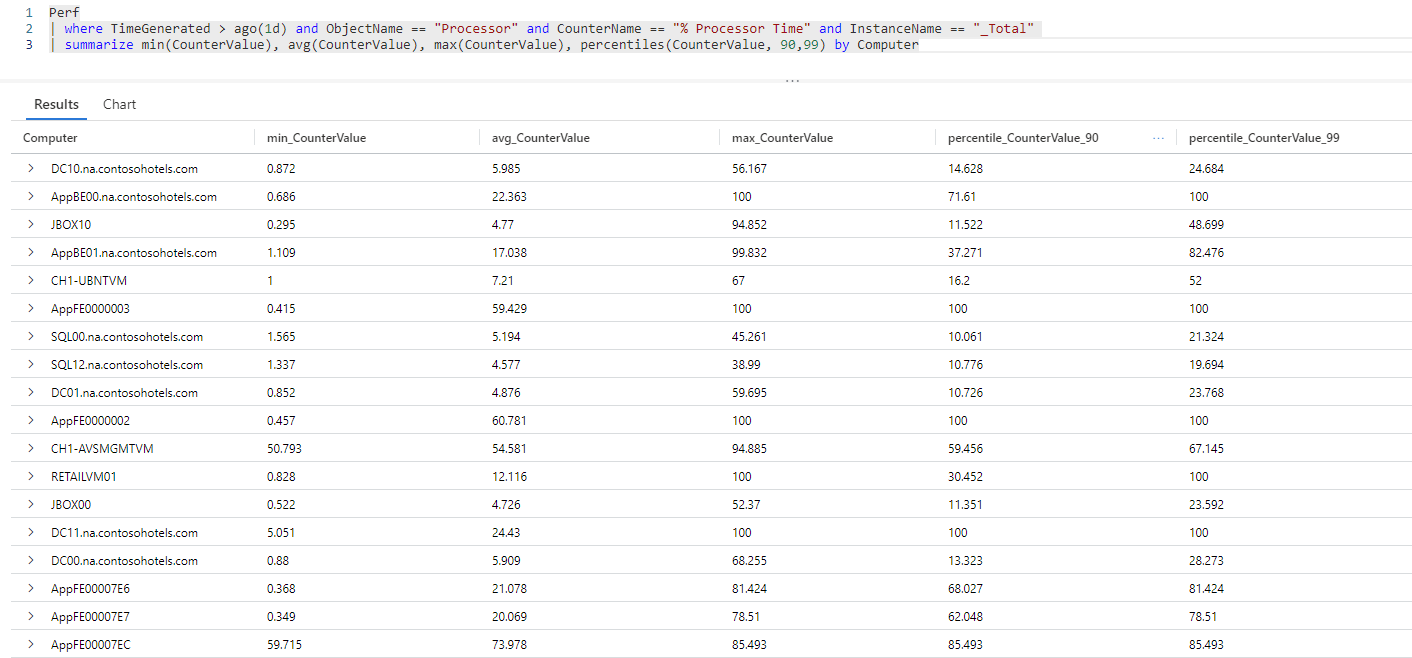
% Processor Time카운터 값이 90번째 및 99번째 백분위수 범위에서 80보다 높은 항목에 대한 쿼리 결과를 필터링합니다.Log Analytics 데모 환경에서 쿼리를 실행하려면 클릭
Perf  // The table you’re querying
| where TimeGenerated > ago(1d) and ObjectName == "Processor" and CounterName == "% Processor Time" and InstanceName == "_Total" // Filters for entries generated in the past day related to total processor time measurements
| summarize min(CounterValue), avg(CounterValue), max(CounterValue), percentiles(CounterValue, 90,99) by Computer // Presents the minimum, maximum, average, 90th and 99th percentile counter values for each computer
| where percentile_CounterValue_90 > 80 and percentile_CounterValue_99 > 80 // Filters previous query results for instances where the 90th and 99th percentile counters are higher than 80
이 쿼리의 결과 집합은 상위 10%와 15%
% Processor Time값이 80을 넘는 모든 컴퓨터로 구성됩니다.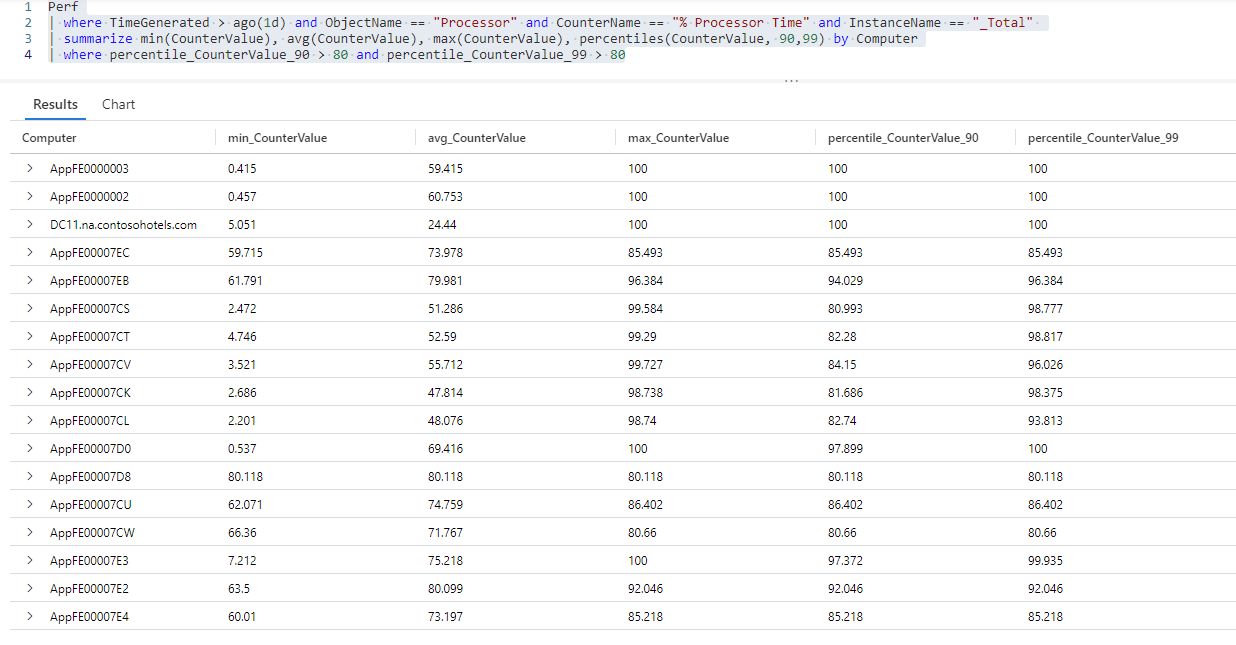


과제: 하트비트 테이블의 운영 체제 정보를 쿼리 결과에 추가
연산자를 사용하여 join 다른 테이블의 정보를 쿼리 결과와 상호 연결하여 쿼리 결과를 더 잘 이해할 수 있는 경우가 많습니다. 자세한 내용은 조인 연산자를 참조하세요.
join 연산자를 사용하여 첫 번째 연습에서 확인했듯이 Heartbeat 테이블에서 사용할 수 있는 각 컴퓨터에서 실행되는 운영 체제에 대한 정보를 추가할 수 있나요?
해결 방법:
Heartbeat테이블에서 쿼리 결과의 각 컴퓨터에서 실행되는 운영 체제에 대한 정보를 추가합니다.Log Analytics 데모 환경에서 쿼리를 실행하려면 클릭
Perf  // The table you’re querying
| where TimeGenerated > ago(1d) and ObjectName == "Processor" and CounterName == "% Processor Time" and InstanceName == "_Total" // Filters for entries generated in the past day related to total processor time measurements
| summarize min(CounterValue), avg(CounterValue), max(CounterValue), percentiles(CounterValue, 90,99) by Computer // Presents the minimum, maximum, average, 90th and 99th percentile counter values for each computer
| where percentile_CounterValue_90 > 80 and percentile_CounterValue_99 > 80 // Filters previous query results for instances where the 90th and 99th percentile counters are higher than 50
| join kind=inner (Heartbeat // Introduces data from the "Heartbeat" table to the previous query results
| where TimeGenerated > ago(1d) // Time range for the data added from the "Heartbeat" table
| distinct Computer, OSType) on Computer // Adds distinct combinations of computer and operating system
이 쿼리 반복은
Heartbeat테이블의Computer및OSType열을 이전 쿼리 결과에 추가합니다.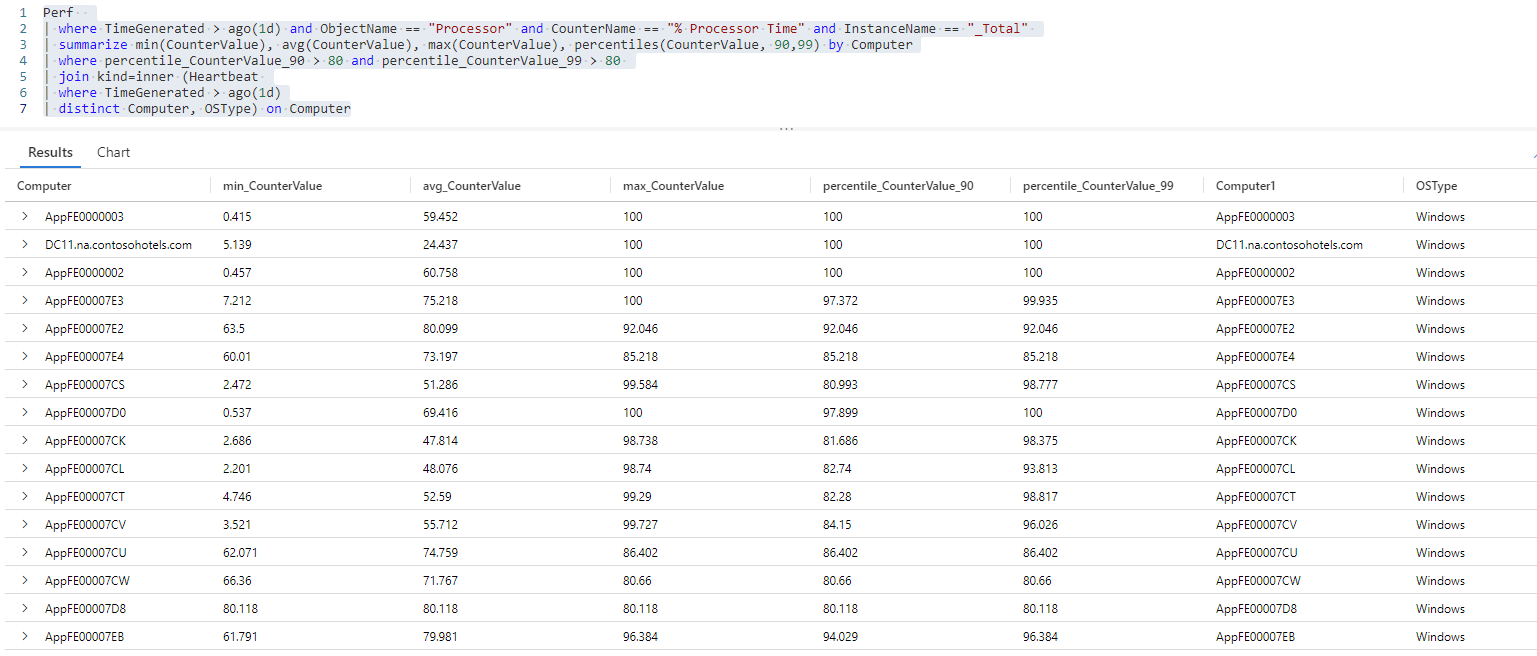
이제
Computer열이 쿼리 결과에 두 번 표시됩니다(Perf테이블의 쿼리에서 한 번,Heartbeat테이블의 쿼리에서 한 번).Heartbeat테이블의Computer열 이름이Computer1(으)로 바뀌었지만 두 테이블에는 동일한 데이터가 포함됩니다. 두 열을 모두 사용하면 두 테이블의 결과 상관 관계를 지정할 수 있지만 이제 중복 열을 필터링할 수 있습니다.쿼리 결과에서
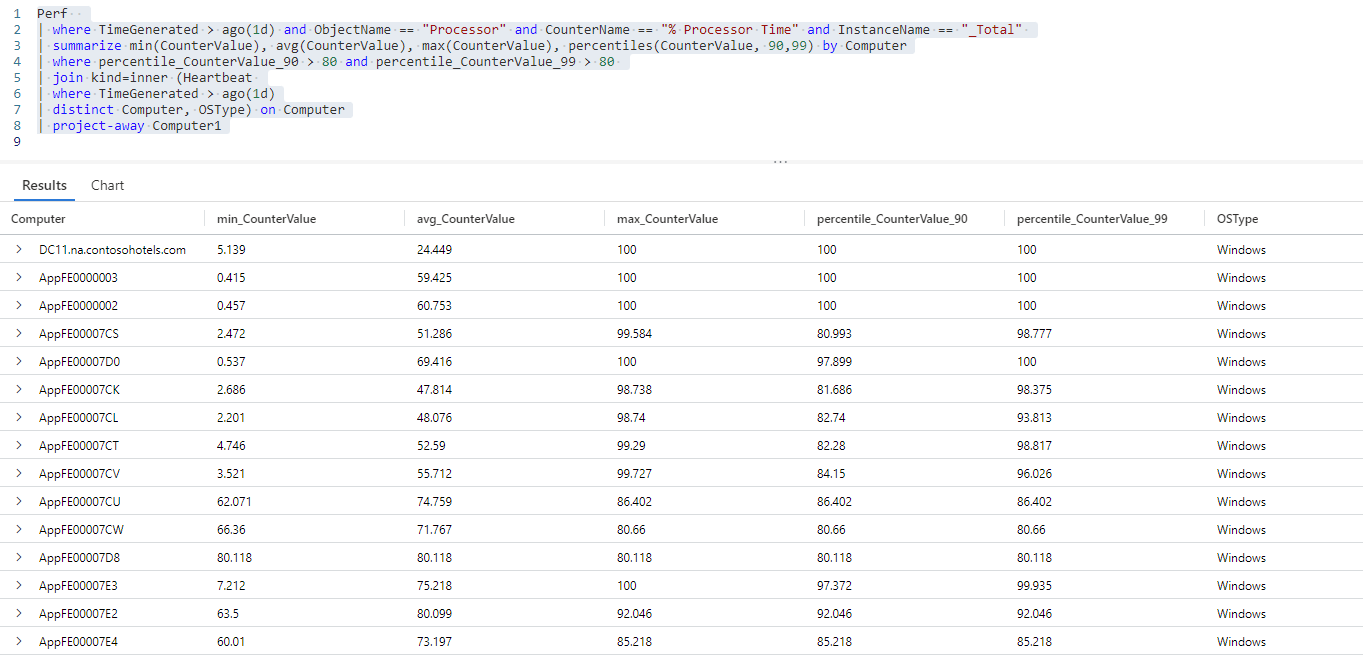
Computer1열을 제거합니다.Log Analytics 데모 환경에서 쿼리를 실행하려면 클릭
Perf  // The table you’re querying
| where TimeGenerated > ago(1d) and ObjectName == "Processor" and CounterName == "% Processor Time" and InstanceName == "_Total" // Filters for entries generated in the past day related to total processor time measurements
| summarize min(CounterValue), avg(CounterValue), max(CounterValue), percentiles(CounterValue, 90,99) by Computer // Presents the minimum, maximum, average, 90th and 99th percentile counter values for each computer
| where percentile_CounterValue_90 > 80 and percentile_CounterValue_99 > 80 // Filters previous query results for instances where the 90th and 99th percentile counters are higher than 50
| join kind=inner (Heartbeat // Introduces data from the "Heartbeat" table to the previous query results
| where TimeGenerated > ago(1d) // Time range for the data added from the "Heartbeat" table
| distinct Computer, OSType) on Computer // Adds distinct combinations of computer and operating system
| project-away Computer1 // Removes the "Computer1" column from the query results
이 쿼리의 결과 집합에는 전체 CPU 용량에 도달한 모든 컴퓨터와 각 컴퓨터에서 실행되는 운영 체제가 나열되므로 추가 분석에 도움이 됩니다.