Historical debugging (C#, Visual Basic, C++)
Applies to: ![]() Visual Studio
Visual Studio ![]() Visual Studio for Mac
Visual Studio for Mac
Note
This article applies to Visual Studio 2017. If you're looking for the latest Visual Studio documentation, see Visual Studio documentation. We recommend upgrading to the latest version of Visual Studio. Download it here
Historical debugging is a mode of debugging that depends on the information collected by IntelliTrace. It allows you to move backward and forward through the execution of your application and inspect its state.
You can use IntelliTrace in Visual Studio Enterprise edition (but not the Professional or Community editions).
Why use historical debugging?
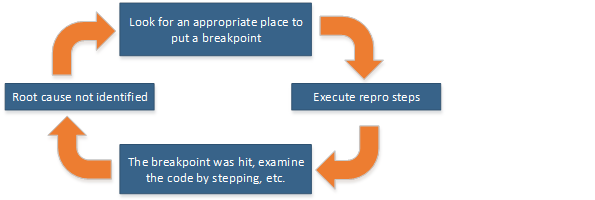
Setting breakpoints to find bugs can be a rather hit-or-miss affair. You set a breakpoint close to the place in your code where you suspect the bug to be, then run the application in the debugger and hope your breakpoint gets hit, and that the place where execution breaks can reveal the source of the bug. If not, you'll have to try setting a breakpoint somewhere else in the code and rerun the debugger, executing your test steps over and over until you find the problem.

You can use IntelliTrace and historical debugging to roam around in your application and inspect its state (call stack and local variables) without having to set breakpoints, restart debugging, and repeat test steps. This can save you a lot of time, especially when the bug is located deep in a test scenario that takes a long time to execute.
How do I start using historical debugging?
IntelliTrace is on by default. All you have to do is decide which events and function calls are of interest to you, and whether you want to view snapshots of your full application state. For more information about defining what you want to look for, see IntelliTrace Features. Feature support varies by language and app type.
- To view snapshots with historical debugging, see Inspect previous app states using IntelliTrace
- To learn how to inspect variables and navigate code, see Inspect your app with historical debugging
- To learn more about debugging with IntelliTrace events, see Walkthrough: Using IntelliTrace.