Debug multiple processes (C#, Visual Basic, C++)
Applies to: ![]() Visual Studio
Visual Studio ![]() Visual Studio for Mac
Visual Studio for Mac
Note
This article applies to Visual Studio 2017. If you're looking for the latest Visual Studio documentation, see Visual Studio documentation. We recommend upgrading to the latest version of Visual Studio. Download it here
Visual Studio can debug a solution that has several processes. You can start and switch between processes, break, continue, and step through source, stop debugging, and end or detach from individual processes.
Start debugging with multiple processes
When more than one project in a Visual Studio solution can run independently, you can select which project the debugger starts. The current startup project appears in bold in Solution Explorer.
To change the startup project, in Solution Explorer, right-click a different project and select Set as StartUp Project.
To start debugging a project from Solution Explorer without making it the startup project, right-click the project and select Debug > Start new instance or Step into new instance.
To set the startup project or multiple projects from solution Properties:
Select the solution in Solution Explorer and then select the Properties icon in the toolbar, or right-click the solution and select Properties.
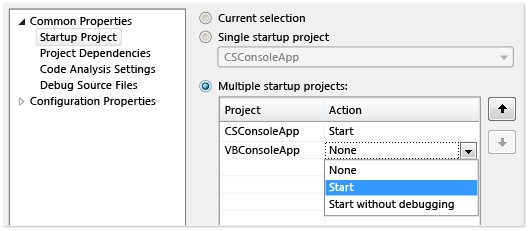
On the Properties page, select Common Properties > Startup Project.

Select Current selection, Single startup project and a project file, or Multiple startup projects.
If you select Multiple startup projects, you can change the startup order and action to take for each project: Start, Start without debugging, or None.
Select Apply, or OK to apply and close the dialog.
Attach to a process
The debugger can also attach to apps running in processes outside of Visual Studio, including on remote devices. After you attach to an app, you can use the Visual Studio debugger. Debugging features might be limited. It depends on whether the app was built with debug information, whether you have access to the app's source code, and whether the JIT compiler is tracking debug information.
For more information, see Attach to running processes.
To attach to a running process:
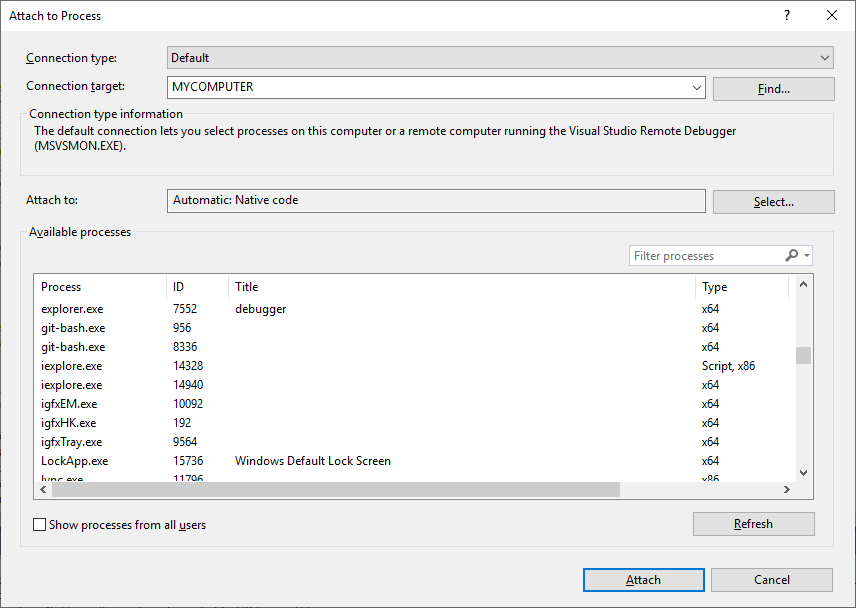
With the app running, select Debug > Attach to Process.

In the Attach to Process dialog box, select the process from the Available Processes list, and then select Attach.
Note
The debugger does not automatically attach to a child process that is started by a debugged process, even if the child project is in the same solution. To debug a child process, either attach to the child process after it starts, or configure the Windows Registry Editor to start the child process in a new debugger instance.
Use the Registry Editor to automatically start a process in the debugger
Sometimes, you might need to debug the startup code for an app that is launched by another process. Examples include services and custom setup actions. You can have the debugger launch and automatically attach to the app.
Start the Windows Registry Editor by running regedit.exe.
In Registry Editor, navigate to HKEY_LOCAL_MACHINE\Software\Microsoft\Windows NT\CurrentVersion\Image File Execution Options.
Select the folder of the app that you want to start in the debugger.
If the app isn't listed as a child folder, right-click Image File Execution Options, select New > Key, and type the app name. Or, right-click the new key in the tree, select Rename, and then enter the app name.
Right-click the new key in the tree and select New > String Value.
Change the name of the new value from New Value #1 to
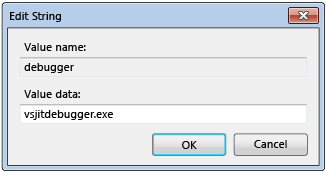
debugger.Right-click debugger and select Modify.

In the Edit String dialog box, type
vsjitdebugger.exein the Value data box, and then select OK.
Debug with multiple processes
When debugging an app with several processes, the breaking, stepping, and continuing debugger commands affect all processes by default. For example, when a process is suspended at a breakpoint, the execution of all other processes is also suspended. You can change this default behavior, to gain more control over the targets of execution commands.
To change whether all processes are suspended when one process breaks:
- Under Tools (or Debug) > Options > Debugging > General, select or clear the Break all processes when one process breaks check box.
Break, step, and continue commands
The following table describes the behaviors of debugging commands when the Break all processes when one process breaks check box is selected or deselected:
| Command | Selected | Deselected |
|---|---|---|
| Debug > Break All | All processes break. | All processes break. |
| Debug > Continue | All processes resume. | All suspended processes resume. |
| Debug > Step Into, Step Over, or Step Out | All processes run while current process steps. Then all processes break. |
Current process steps. Suspended processes resume. Running processes continue. |
| Debug > Step Into Current Process, Step Over Current Process, or Step Out Current Process | N/A | Current process steps. Other processes maintain their existing state (suspended or running). |
| Source window Breakpoint | All processes break. | Only source window process breaks. |
| Source window Run to cursor The source window must be in the current process. |
All processes run while source window process runs to cursor and then breaks. Then all other processes break. |
Source window process runs to cursor. Other processes maintain their existing state (suspended or running). |
| Processes window > Break Process | N/A | Selected process breaks. Other processes maintain their existing state (suspended or running). |
| Processes window > Continue Process | N/A | Selected process resumes. Other processes maintain their existing state (suspended or running). |
Find the source and symbol (.pdb) files
To navigate the source code of a process, the debugger needs access to its source files and symbol files. For more information, see Specify symbol (.pdb) and source files.
If you can't access the files for a process, you can navigate by using the Disassembly window. For more information, see How to: Use the Disassembly window.
Switch between processes
You can attach to multiple processes when you're debugging, but only one process is active in the debugger at any given time. You can set the active or current process in the Debug Location toolbar, or in the Processes window. To switch between processes, both processes must be in break mode.
To set the current process from the Debug Location toolbar:
To open the Debug Location toolbar, select View > Toolbars > Debug Location.
During debugging, on the Debug Location toolbar, select the process you want to set as the current process from the Process dropdown.

To set the current process from the Processes window:
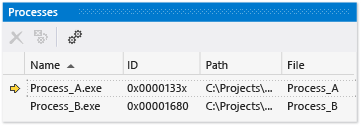
To open the Processes window, while debugging, select Debug > Windows > Processes.
In the Processes window, the current process is marked by a yellow arrow. Double-click the process you want to set as the current process.

Switching to a process sets it as the current process for debugging purposes. Debugger windows show the state for the current process, and stepping commands affect only the current process.
Stop debugging with multiple processes
By default, when you select Debug > Stop Debugging, the debugger ends or detaches from all processes.
If the current process was launched in the debugger, the process is ended.
If you attached the debugger to the current process, the debugger detaches from the process and leaves the process running.
If you start debugging a process from a Visual Studio solution, then attach to another process that is already running, and then choose Stop Debugging, the debugging session ends. The process that was started in Visual Studio ends, while the process you attached to keeps running.
To control the way that Stop Debugging affects an individual process, in the Processes window, right-click a process, and then select or clear the Detach when debugging stopped check box.
Note
The Break all processes when one process breaks debugger option does not affect stopping, terminating, or detaching from processes.
Stop, terminate, and detach commands
The following table describes the behaviors of the debugger stop, terminate, and detach commands with multiple processes:
| Command | Description |
|---|---|
| Debug > Stop Debugging | Unless the behavior is changed in the Processes window, processes started by the debugger are ended, and attached processes are detached. |
| Debug > Terminate All | All processes are ended. |
| Debug > Detach All | The debugger detaches from all processes. |
| Processes window > Detach Process | The debugger detaches from the selected process. Other processes maintain their existing state (suspended or running). |
| Processes window > Terminate Process | The selected process is ended. Other processes maintain their existing state (suspended or running). |
| Processes window > Detach when debugging stops | If selected, Debug > Stop Debugging detaches from the selected process. If not selected, Debug > Stop Debugging ends the selected process. |