Walkthrough: Using Graphics Diagnostics to Debug a Compute Shader
Note
This article applies to Visual Studio 2015. If you're looking for the latest Visual Studio documentation, see Visual Studio documentation. We recommend upgrading to the latest version of Visual Studio. Download it here
This walkthrough demonstrates how to use the Visual Studio Graphics Diagnostics tools to investigate a compute shader that generates incorrect results.
This walkthrough illustrates these tasks:
Using the Graphics Event List to locate potential sources of the problem.
Using the Graphics Event Call Stack to determine which compute shader is executed by a DirectCompute
Dispatchevent.Using the Graphics Pipeline Stages window and HLSL debugger to examine the compute shader that's the source of the problem.
Scenario
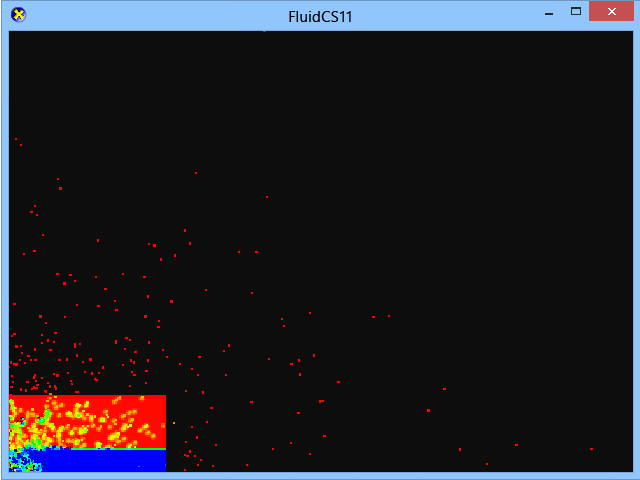
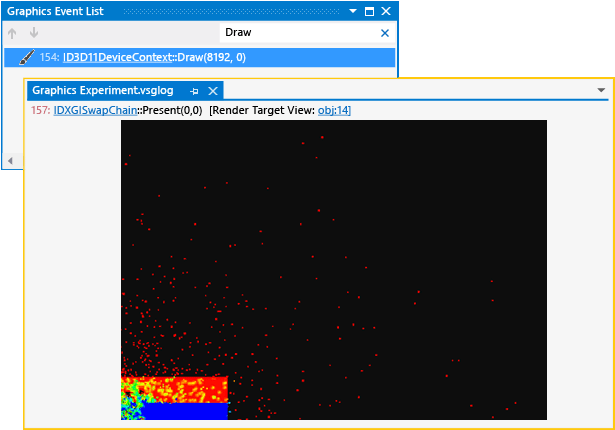
In this scenario, you have written a fluid-dynamics simulation that uses DirectCompute to perform the most computation-intensive parts of the simulation update. When the app is run, the rendering of the dataset and UI look correct, but the simulation does not behave as expected. By using Graphics Diagnostics, you can capture the problem to a graphics log so that you can debug the app. The problem looks like this in the app:
For information about how to capture graphics problems in a graphics log, see Capturing Graphics Information.
Investigation
You can use the Graphics Diagnostics tools to load the graphics log file so that you can inspect the captured frames.
To examine a frame in a graphics log
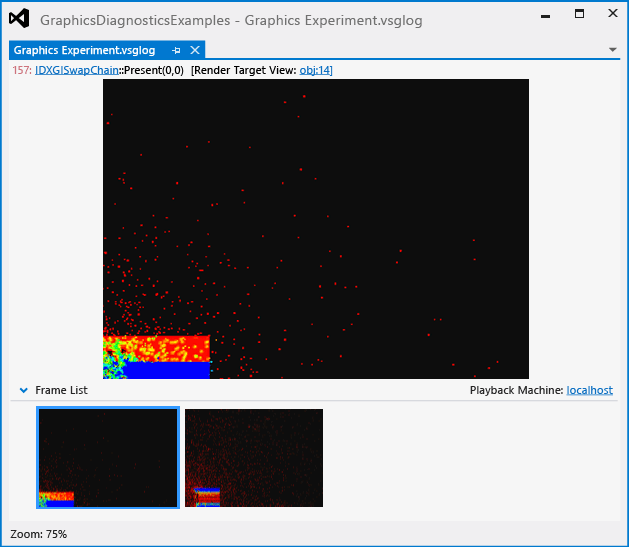
In Visual Studio, load a graphics log that contains a frame that exhibits the incorrect simulation results. A new Graphics Diagnostics tab appears in Visual Studio. In the top part of this tab is the render target output of the selected frame. In the bottom part is the Frame List, which displays a thumbnail of each captured frame.
In the Frame List, select a frame that demonstrates the incorrect simulation behavior. Even though the error appears to be in the simulation code and not the rendering code, you still have to choose a frame because DirectCompute events are captured on a frame-by-frame basis, together with Direct3D events. In this scenario, the graphics log tab looks like this:
After you select a frame that demonstrates the problem, you can use the Graphics Event List to diagnose it. The Graphics Event List contains an event for every DirectCompute call and Direct3D API call that was made during the active frame—for example, API calls to run a computation on the GPU, or to render the dataset or UI. In this case, we are interested in
Dispatchevents that represent parts of the simulation that run on the GPU.
To find the Dispatch event for the simulation update
On the Graphics Diagnostics toolbar, choose Event List to open the Graphics Event List window.
Inspect the Graphics Event List for the draw event that renders the dataset. To make this easier, enter
Drawin the Search box in the upper-right corner of the Graphics Event List window. This filters the list so that it only contains events that have "Draw" in their titles. In this scenario, you discover that these draw events occurred: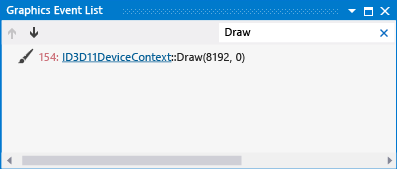
Move through each draw event while you watch the render target in the graphics log document tab.
Stop when the render target first displays the rendered dataset. In this scenario, the dataset is rendered in the first draw event. The error in the simulation is shown:
Now inspect the Graphics Event List for the
Dispatchevent that updates the simulation. Because it's likely that the simulation is updated before it is rendered, you can concentrate first onDispatchevents that occur before the draw event that renders the results. To make this easier, modify the Search box to readDraw;Dispatch;CSSetShader(. This filters the list so that it also containsDispatchandCSSetShaderevents in addition to draw events. In this scenario, you discover that severalDispatchevents occurred before the draw event: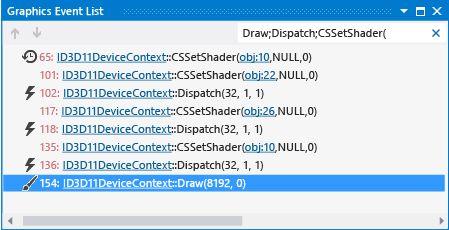
Now that you know which few of potentially many
Dispatchevents could correspond to the problem, you can examine them in more detail.
To determine which compute shader a Dispatch call executes
On the Graphics Diagnostics toolbar, choose Event Call Stack to open the Graphics Event Call Stack window.
Starting from the draw event that renders the simulation results, move backwards through each previous
CSSetShaderevent. Then, in the Graphics Event Call Stack window, choose the top-most function to navigate to the call site. At the call site, you can use the first parameter of the CSSetShader function call to determine which compute shader is executed by the nextDispatchevent.In this scenario, there are three pairs of
CSSetShaderandDispatchevents in each frame. Working backwards, the third pair represents the integration step (where the fluid particles are actually moved), the second pair represents the force-calculation step (where forces that affect each particle are calculated), and the first pair represents the density-calculation step.
To debug the compute shader
On the Graphics Diagnostics toolbar, choose Pipeline Stages to open the Graphics Pipeline Stages window.
Select the third
Dispatchevent (the one that immediately precedes the draw event) and then, in the Graphics Pipeline Stages window, under the Compute Shader stage, choose Start Debugging.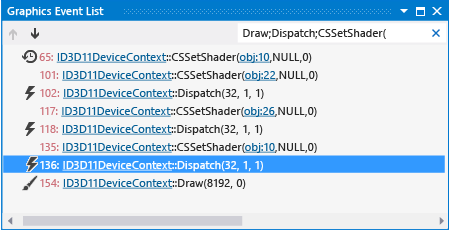
The HLSL Debugger is started at the shader that performs the integration step.
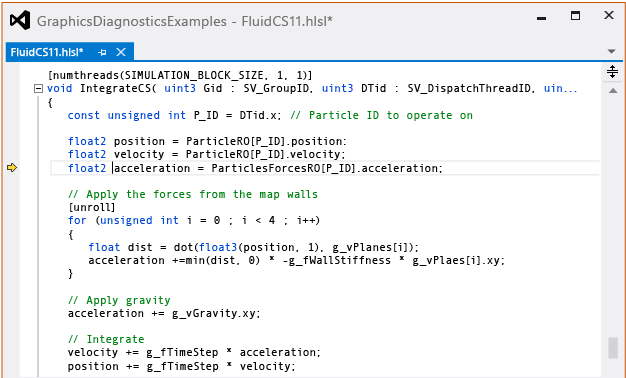
Examine the compute-shader source code for the integration step to search for the source of the error. When you use Graphics Diagnostics to debug HLSL compute-shader code, you can step through code and use other familiar debugging tools such as watch windows. In this scenario, you determine that there does not appear to be an error in the compute shader that performs the integration step.
To stop debugging the compute shader, on the Debug toolbar, choose Stop Debugging (Keyboard: Shift+F5).
Next, select the second
Dispatchevent and start debugging the compute shader just like you did in the earlier step.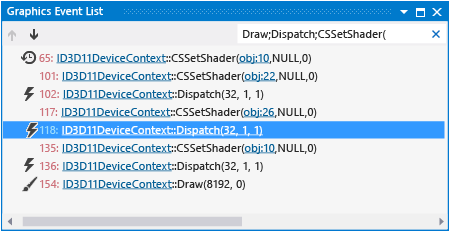
The HLSL Debugger is started at the shader that calculates the forces that act on each fluid particle.
Examine the compute shader source code for the force-calculation step. In this scenario, you determine that the source of the error is here.
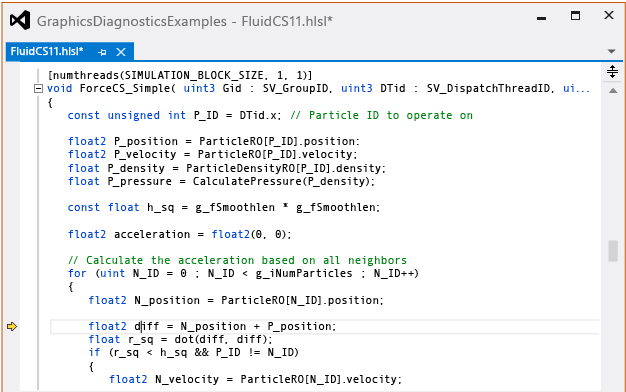
After you have determined the location of the error, you can stop debugging and modify the compute-shader source code to correctly calculate the distance between the interacting particles. In this scenario, you just change the line
float2 diff = N_position + P_position;tofloat2 diff = N_position - P_position;: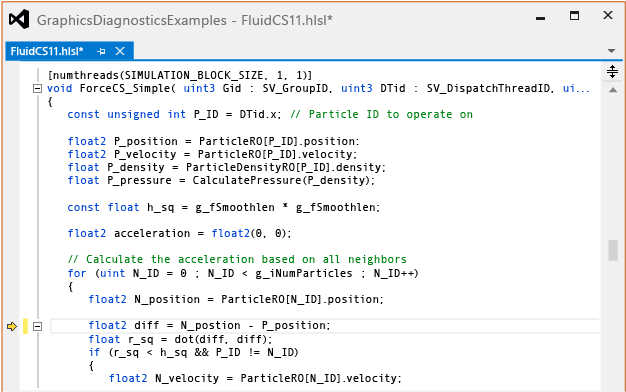
In this scenario, because the compute shaders are compiled at run time, you can just restart the app after you make the changes to observe how they affect the simulation. You don't have to rebuild the app. When you run the app, you discover that the simulation now behaves correctly.
