series_fit_poly()
적용 대상: ✅Microsoft Fabric✅Azure Data Explorer✅Azure Monitor✅Microsoft Sentinel
독립 변수(x_series)에서 종속 변수(y_series)에 다항식 회귀를 적용합니다. 이 함수는 여러 계열(동적 숫자 배열)이 포함된 테이블을 사용하고 다항식 회귀를 사용하여 각 계열에 가장 적합한 고차 다항어를 생성합니다.
팁
- 메이크 시리즈 연산자가 만든 균등 간격 계열의 선형 회귀의 경우 더 간단한 함수 series_fit_line()를 사용합니다. 예제 2를 참조하세요.
- x_series 제공되고 회귀가 높은 수준까지 수행되는 경우 [0-1] 범위로 정규화하는 것이 좋습니다. 예제 3을 참조하세요.
- x_series datetime 형식인 경우 double로 변환하고 정규화해야 합니다. 예제 3을 참조하세요.
- 인라인 Python을 사용하는 다항식 회귀의 참조 구현은 series_fit_poly_fl()를 참조하세요.
구문
T | extend series_fit_poly( y_series [ , x_series , 도 ])
구문 규칙에 대해 자세히 알아봅니다.
매개 변수
| 이름 | Type | 필수 | 설명 |
|---|---|---|---|
| y_series | dynamic |
✔️ | 종속 변수를 포함하는 숫자 값의 배열입니다. |
| x_series | dynamic |
독립 변수를 포함하는 숫자 값의 배열입니다. 간격이 고르지 않은 계열에만 필요합니다. 지정하지 않으면 기본값 [1, 2, ..., length(y_series)]로 설정됩니다. | |
| 정도 | 맞춤할 다항식의 필수 순서입니다. 예를 들어 선형 회귀의 경우 1, 이차 회귀의 경우 2 등입니다. 기본값은 선형 회귀를 나타내는 1입니다. |
반품
함수는 series_fit_poly() 다음 열을 반환합니다.
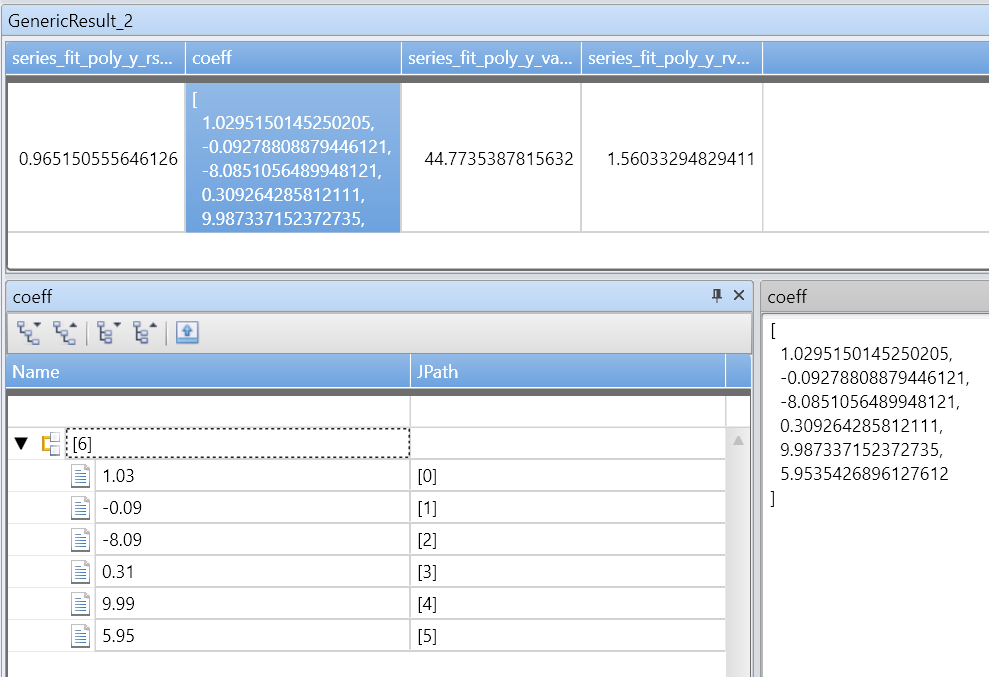
rsquare: r-square 는 맞춤 품질의 표준 측정값입니다. 값은 [0-1] 범위의 숫자로, 여기서 1은 가장 적합하며 0은 데이터의 순서가 지정되지 않고 줄에 맞지 않음을 의미합니다.coefficients: 가장 높은 전력 계수에서 가장 낮은 값으로 정렬된 지정된 각도로 가장 적합한 다항식 계수의 계수를 보유하는 숫자 배열입니다.variance: 종속 변수의 분산(y_series)입니다.rvariance: 입력 데이터 값과 근사값 간의 차이인 잔차 분산입니다.poly_fit: 가장 적합한 다항식의 일련의 값을 포함하는 숫자 배열입니다. 계열 길이는 종속 변수(y_series)의 길이와 같습니다. 차트에 사용되는 값입니다.
예제
예 1
x &y 축에서 노이즈가 있는 다섯 번째 순서 다항식:
range x from 1 to 200 step 1
| project x = rand()*5 - 2.3
| extend y = pow(x, 5)-8*pow(x, 3)+10*x+6
| extend y = y + (rand() - 0.5)*0.5*y
| summarize x=make_list(x), y=make_list(y)
| extend series_fit_poly(y, x, 5)
| project-rename fy=series_fit_poly_y_poly_fit, coeff=series_fit_poly_y_coefficients
|fork (project x, y, fy) (project-away x, y, fy)
| render linechart


예제 2
degree=1이 일치하는지 series_fit_poly 확인합니다.series_fit_line
demo_series1
| extend series_fit_line(y)
| extend series_fit_poly(y)
| project-rename y_line = series_fit_line_y_line_fit, y_poly = series_fit_poly_y_poly_fit
| fork (project x, y, y_line, y_poly) (project-away id, x, y, y_line, y_poly)
| render linechart with(xcolumn=x, ycolumns=y, y_line, y_poly)


예제 3
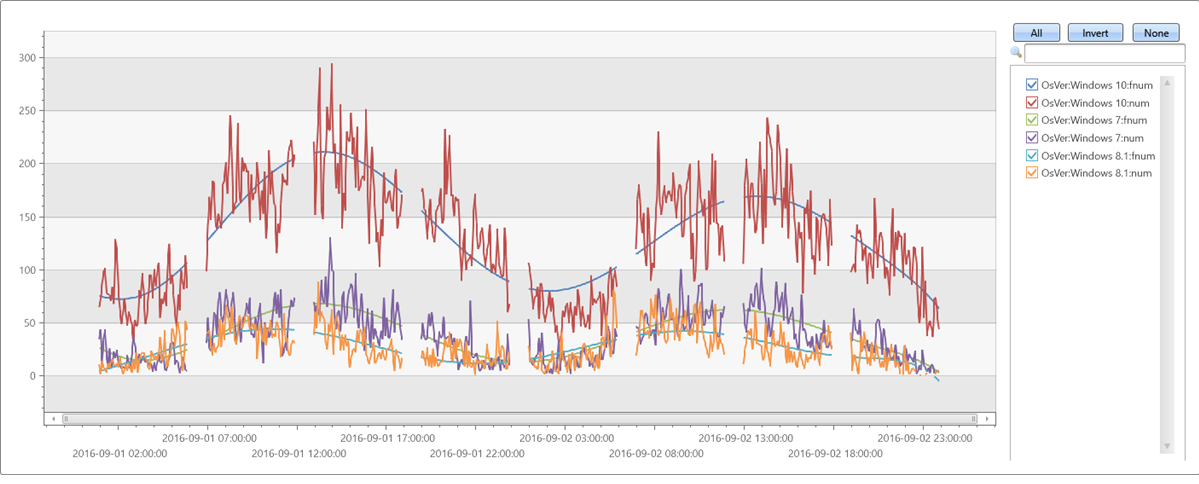
불규칙(균일하지 않은 간격) 시계열:
//
//  x-axis must be normalized to the range [0-1] if either degree is relatively big (>= 5) or original x range is big.
//  so if x is a time axis it must be normalized as conversion of timestamp to long generate huge numbers (number of 100 nano-sec ticks from 1/1/1970)
//
//  Normalization: x_norm = (x - min(x))/(max(x) - min(x))
//
irregular_ts
| extend series_stats(series_add(TimeStamp, 0))                                                                 //  extract min/max of time axis as doubles
| extend x = series_divide(series_subtract(TimeStamp, series_stats__min), series_stats__max-series_stats__min)  // normalize time axis to [0-1] range
| extend series_fit_poly(num, x, 8)
| project-rename fnum=series_fit_poly_num_poly_fit
| render timechart with(ycolumns=num, fnum)
