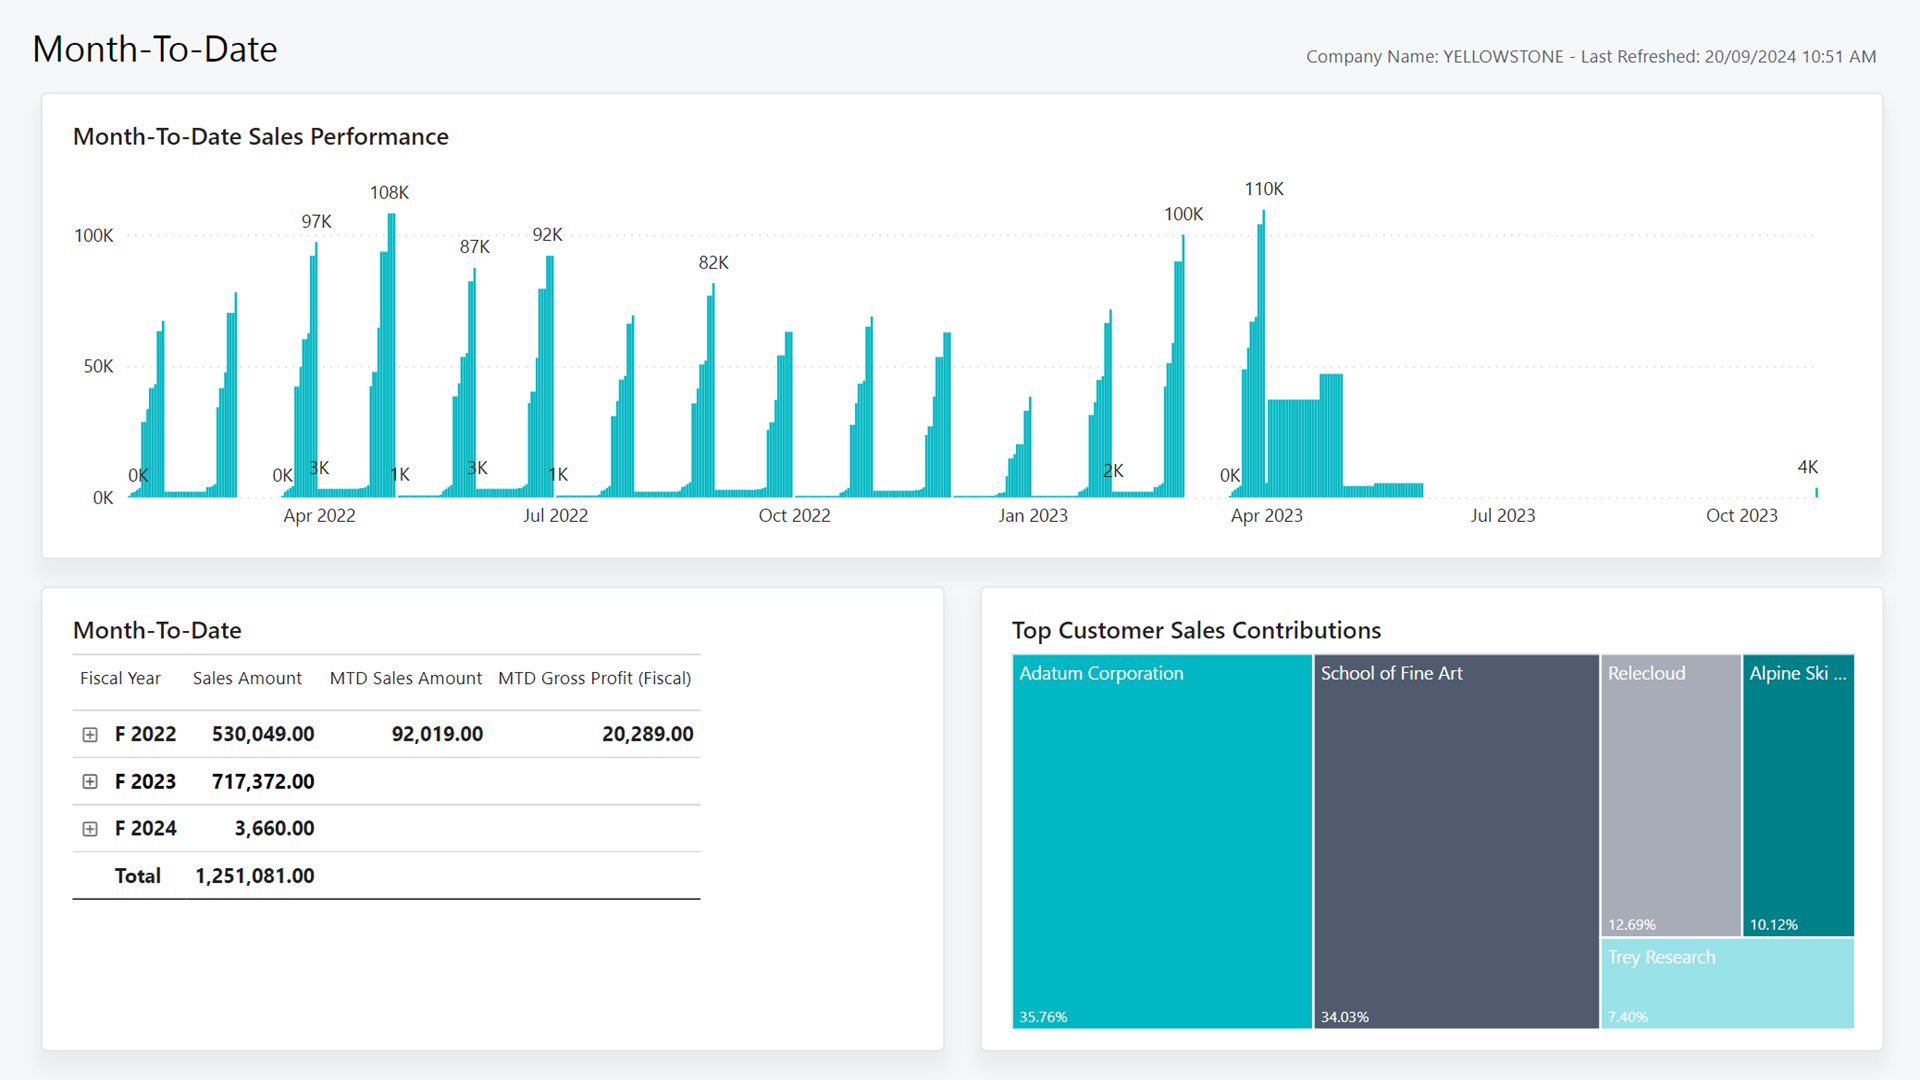
Month-to-Date (MTD) (Power BI Report)
APPLIES TO: Generally available in Business Central 2024 release wave 2 (version 25.1).
The Month-to-Date (MTD) report is a must-have report for executives and managers. The report helps them monitor the progress of their sales revenue for the current month. This report provides a detailed overview of the total revenue generated from sales activities from the start of the month up until the current date.
Note
The month to date (MTD) figure doesn't include revenue generated on the current date because sales activities might still be ongoing.
Use the report
Leadership and management teams use the report to monitor sales growth per month.
Business leaders use the report to view the organization's sales performance for the current month. This report offers an easy way to monitor sales revenue progress from the beginning of the month up until the current day. By analyzing the sales figures for the current month and previous months, you can identify trends and make strategic decisions for your organization. With this information at your fingertips, you can make data-driven decisions that help you optimize your sales strategy and drive revenue growth for your business.
Sales managers can use the report to analyze and compare the organization's current sales performance with previous years. The gross profit figures can provide a broader context for the current sales performance. The report also shows a breakdown of sales contributions from top customers. The breakdown lets you identify which customers your team should focus on and maintain good relationships with to improve their sales performance. With these insights, you can guide your team better and take actions to improve their sales.
Key performance indicators
The report includes the following key performance indicators (KPI) and measures:
Click on the link for a KPI to learn more about what it means, how it is calculated, and what data was used in the calculations.
Tip
You can easily track the KPIs that the Power BI reports display against your business objectives. To learn more, go to Track your business KPIs with Power BI metrics.
Data used in the report
The report uses data from the following tables in Business Central:
- Value Entry
- Sales Line
- Customer
Try the report
Try the report here: Month-to-Date
Tip
If you hold down the CTRL key while you select the report link, the report opens on a new browser tab. In this way, you can stay on the current page while you explore the report on the other browser tab.
See also
Track your business KPIs with Power BI metrics
Ad hoc analysis of sales data
Built-in sales reports
Sales analytics overview
Sales overview
