파이프라인 기간 샘플 보고서
Azure DevOps Services | Azure DevOps Server 2022 | Azure DevOps Server 2020
이 문서에서는 파이프라인 기간을 가져오는 방법 또는 파이프라인을 실행하는 데 걸린 시간을 보여줍니다. 이 보고서는 파이프라인 기간 보고서의 '파이프라인 기간' 차트에 있는 기간 요약 메트릭과 유사합니다.
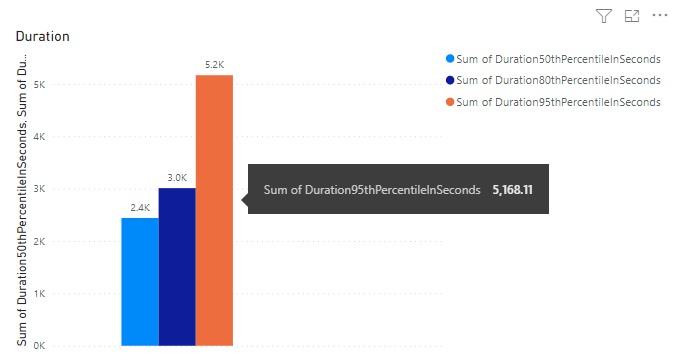
다음 이미지는 2022년 9월부터 2022년 12월 15일까지 실행되는 모든 파이프라인에 대한 특정 파이프라인에 대한 기간 보고서의 예를 보여줍니다.

Important
Analytics Service의 OData 피드에 대한 Power BI 통합 및 액세스는 일반적으로 Azure DevOps Services 및 Azure DevOps Server 2020 이상 버전에서 사용할 수 있습니다. 이 문서에서 제공하는 샘플 쿼리는 Azure DevOps Server 2020 이상 버전에 대해서만 유효하며 v3.0 미리 보기 이상 버전에 따라 달라집니다. 이러한 쿼리를 사용하고 피드백을 제공하는 것이 좋습니다.
필수 조건
- 액세스: 최소한 기본 액세스 권한이 있는 프로젝트의 멤버여야 합니다.
- 사용 권한: 기본적으로 프로젝트 멤버는 분석을 쿼리하고 뷰를 만들 수 있는 권한이 있습니다.
- 서비스 및 기능 사용 및 일반 데이터 추적 활동과 관련된 기타 필수 구성 요소에 대한 자세한 내용은 Analytics에 액세스하기 위한 사용 권한 및 필수 구성 요소를 참조 하세요.
참고 항목
이 문서에서는 OData 쿼리를 사용하여 샘플 보고서 개요를 읽고 Power BI에 대한 기본적인 이해를 가지고 있다고 가정합니다 .
샘플 쿼리
엔터티 집합의 PipelineRuns 다음 쿼리를 사용하여 서로 다르지만 유사한 파이프라인 기간 보고서를 만들 수 있습니다.
참고 항목
필터 또는 보고서 용도로 사용 가능한 속성을 확인하려면 Azure Pipelines에 대한 메타데이터 참조를 참조 하세요. 에서 사용할 수 있는 값 또는 아래 값을 Property 사용하여 쿼리를 EntityType 필터링하거나 NavigationPropertyBinding Path 속성을 반환할 수 있습니다 EntitySet. 각각 EntitySet 은 .에 EntityType해당합니다. 각 값의 데이터 형식에 대한 자세한 내용은 해당 EntityType값에 대해 제공된 메타데이터를 검토하세요.
지정된 파이프라인에 대한 백분위수 기간 반환
다음 Power BI 쿼리를 복사하여 데이터>빈 쿼리 가져오기 창에 직접 붙여넣습니다. 자세한 내용은 OData 쿼리를 사용하는 샘플 보고서 개요를 참조 하세요.
let
   Source = OData.Feed ("https://analytics.dev.azure.com/{organization}/{project}/_odata/v3.0-preview/PipelineRuns?"
        &"$apply=filter( "
                &"Pipeline/PipelineName eq '{pipelinename}' "
                &"and CompletedDate ge {startdate} "
                &"and (SucceededCount eq 1 or PartiallySucceededCount eq 1) "
        &") "
        &"/compute( "
            &"percentile_cont(TotalDurationSeconds, 0.5) as Duration50thPercentileInSeconds, "
                &"percentile_cont(TotalDurationSeconds, 0.8) as Duration80thPercentileInSeconds, "
                &"percentile_cont(TotalDurationSeconds, 0.95) as Duration95thPercentileInSeconds) "
            &"/groupby( "
                &"(Duration50thPercentileInSeconds, Duration80thPercentileInSeconds,Duration95thPercentileInSeconds)) "
    ,null, [Implementation="2.0",OmitValues = ODataOmitValues.Nulls,ODataVersion = 4])
in
    Source
대체 문자열 및 쿼리 분석
다음 문자열을 값으로 바꿉니다. 대괄호를 대체에 {} 포함하지 마세요. 예를 들어 조직 이름이 "Fabrikam"{organization}Fabrikam{Fabrikam}인 경우 .
{organization}- 조직 이름{project}- 팀 프로젝트 이름{pipelinename}- 파이프라인 이름입니다. 예:Fabrikam hourly build pipeline{startdate}- 보고서를 시작할 날짜입니다. 형식: YYYY-MM-DDZ. 예:2021-09-01Z2021년 9월 1일을 나타냅니다. 따옴표나 대괄호로 묶지 말고 월과 날짜 둘 다에 두 숫자를 사용합니다.
쿼리 분석
다음 표에서는 쿼리의 각 부분을 설명합니다.
쿼리 파트
설명
$apply=filter(
Start filter() 절입니다.
Pipeline/PipelineName eq '{pipelinename}'
지정된 파이프라인에 대한 파이프라인 실행을 반환합니다.
and CompletedDate ge {startdate}
반환 파이프라인은 지정된 날짜 또는 그 이후에 실행됩니다.
and (SucceededCount eq 1 or PartiallySucceededCount eq 1)
성공 또는 부분적으로 성공한 실행만 반환합니다.
)
Close filter() 절입니다.
/compute(
Start compute() 절입니다.
percentile_cont(TotalDurationSeconds, 0.5) as Duration50thPercentileInSeconds,
필터 조건과 일치하는 모든 파이프라인 실행의 파이프라인 기간의 50번째 백분위수입니다.
percentile_cont(TotalDurationSeconds, 0.8) as Duration80thPercentileInSeconds,
필터 조건과 일치하는 모든 파이프라인 실행의 파이프라인 기간의 80번째 백분위수 계산
percentile_cont(TotalDurationSeconds, 0.95) as Duration95thPercentileInSeconds)
필터 조건과 일치하는 모든 파이프라인 실행의 파이프라인 기간 중 95번째 백분위수 계산
/groupby(
Start groupby() 절입니다.
(Duration50thPercentileInSeconds, Duration80thPercentileInSeconds,Duration95thPercentileInSeconds))
응답을 Duration50thPercentileInSeconds로 Duration80thPercentileInSeconds그룹화하고 Duration95thPercentileInSeconds 절을 종료합니다 groupby .
지정된 파이프라인 ID에 대한 백분위수 기간 반환
파이프라인의 이름을 바꿀 수 있습니다. 파이프라인 이름이 변경될 때 Power BI 보고서가 중단되지 않도록 하려면 파이프라인 이름 대신 파이프라인 ID를 사용합니다. 파이프라인 실행 페이지의 URL에서 파이프라인 ID를 가져올 수 있습니다.
https://dev.azure.com/{organization}/{project}/_build?definitionId= {pipelineid}
다음 Power BI 쿼리를 복사하여 데이터>빈 쿼리 가져오기 창에 직접 붙여넣습니다. 자세한 내용은 OData 쿼리를 사용하는 샘플 보고서 개요를 참조 하세요.
let
   Source = OData.Feed ("https://analytics.dev.azure.com/{organization}/{project}/_odata/v3.0-preview/PipelineRuns?"
        &"$apply=filter( "
                &"PipelineId  eq {pipelineid} "
                &"and CompletedDate ge {startdate} "
                &"and (SucceededCount eq 1 or PartiallySucceededCount eq 1) "
        &") "
        &"/compute( "
            &"percentile_cont(TotalDurationSeconds, 0.5) as Duration50thPercentileInSeconds, "
                &"percentile_cont(TotalDurationSeconds, 0.8) as Duration80thPercentileInSeconds, "
                &"percentile_cont(TotalDurationSeconds, 0.95) as Duration95thPercentileInSeconds) "
            &"/groupby( "
                &"(Duration50thPercentileInSeconds, Duration80thPercentileInSeconds,Duration95thPercentileInSeconds)) "
    ,null, [Implementation="2.0",OmitValues = ODataOmitValues.Nulls,ODataVersion = 4])
in
    Source
지정된 파이프라인에 대한 백분위수 기간을 반환하고 분기별로 필터링합니다.
특정 분기에 대한 파이프라인 기간만 보려면 다음 쿼리를 사용합니다. 보고서를 만들려면 열 데이터 형식 변경 및 클러스터형 세로 막대형 차트 보고서 만들기 섹션에 설명된 내용과 함께 다음 추가 단계를 수행합니다.
- 로 확장
Branch합니다Branch.BranchName. - 필드 Branch.BranchName 을 X축에 추가합니다.
다음 Power BI 쿼리를 복사하여 데이터>빈 쿼리 가져오기 창에 직접 붙여넣습니다. 자세한 내용은 OData 쿼리를 사용하는 샘플 보고서 개요를 참조 하세요.
let
   Source = OData.Feed ("https://analytics.dev.azure.com/{organization}/{project}/_odata/v3.0-preview/PipelineRuns?"
        &"$apply=filter( "
                &"Pipeline/PipelineName eq '{pipelinename}' "
                &"and CompletedDate ge {startdate} "
                &"and (SucceededCount eq 1 or PartiallySucceededCount eq 1) "
        &") "
        &"/compute( "
            &"percentile_cont(TotalDurationSeconds, 0.5, BranchSK) as Duration50thPercentileInSeconds, "
                &"percentile_cont(TotalDurationSeconds, 0.8, BranchSK) as Duration80thPercentileInSeconds, "
                &"percentile_cont(TotalDurationSeconds, 0.95, BranchSK) as Duration95thPercentileInSeconds) "
            &"/groupby( "
                &"(Duration50thPercentileInSeconds, Duration80thPercentileInSeconds,Duration95thPercentileInSeconds, Branch/BranchName)) "
    ,null, [Implementation="2.0",OmitValues = ODataOmitValues.Nulls,ODataVersion = 4])
in
    Source
모든 프로젝트 파이프라인에 대한 백분위수 기간 반환
단일 보고서에서 프로젝트의 모든 파이프라인에 대한 기간을 보려면 다음 쿼리를 사용합니다. 보고서를 만들려면 열 데이터 형식 변경 및 클러스터형 세로 막대형 차트 보고서 만들기 섹션에 설명된 내용과 함께 다음 추가 단계를 수행합니다.
- 로 확장
Pipeline합니다Pipeline.PipelineName. - X축에 PIpeline.PipelineName 필드를 추가합니다.
여기에 필요한 대로 자세한 유사한 단계가 있는 샘플 보고서에 대한 모든 파이프라인에 대한 결과 요약도 참조하세요.
다음 Power BI 쿼리를 복사하여 데이터>빈 쿼리 가져오기 창에 직접 붙여넣습니다. 자세한 내용은 OData 쿼리를 사용하는 샘플 보고서 개요를 참조 하세요.
let
   Source = OData.Feed ("https://analytics.dev.azure.com/{organization}/{project}/_odata/v3.0-preview/PipelineRuns?"
        &"$apply=filter( "
                &"CompletedDate ge {startdate} "
                &"and (SucceededCount eq 1 or PartiallySucceededCount eq 1) "
                &"    ) "
        &"/compute( "
        &"percentile_cont(TotalDurationSeconds, 0.5, PipelineId) as Duration50thPercentileInSeconds, "
            &"percentile_cont(TotalDurationSeconds, 0.8, PipelineId) as Duration80thPercentileInSeconds, "
                &"percentile_cont(TotalDurationSeconds, 0.95, PipelineId) as Duration95thPercentileInSeconds) "
                &"/groupby( "
            &"(Duration50thPercentileInSeconds, Duration80thPercentileInSeconds,Duration95thPercentileInSeconds, Pipeline/PipelineName)) "
    ,null, [Implementation="2.0",OmitValues = ODataOmitValues.Nulls,ODataVersion = 4])
in
    Source
열 데이터 형식 변경
변환 메뉴에서 다음 열의 데이터 형식을 10진수로 변경합니다. 방법을 알아보려면 열 데이터 형식 변환을 참조 하세요.
Duration50thPercentileInSecondsDuration80thPercentileInSecondsDuration95thPercentileInSeconds
(선택 사항) 열 필드 이름 바꾸기
열 필드의 이름을 바꿀 수 있습니다. 예를 들어 열 Pipeline.PipelineName Pipeline Name이름을 TotalCount Total Count열로 바꿀 수 있습니다. 방법을 알아보려면 열 필드 이름을 바꿉니다.
쿼리를 닫고 변경 내용 적용
모든 데이터 변환을 완료한 후 홈 메뉴에서 닫기 및 적용 을 선택하여 쿼리를 저장하고 Power BI의 보고서 탭으로 돌아갑니다.

클러스터형 세로 막대형 차트 보고서 만들기
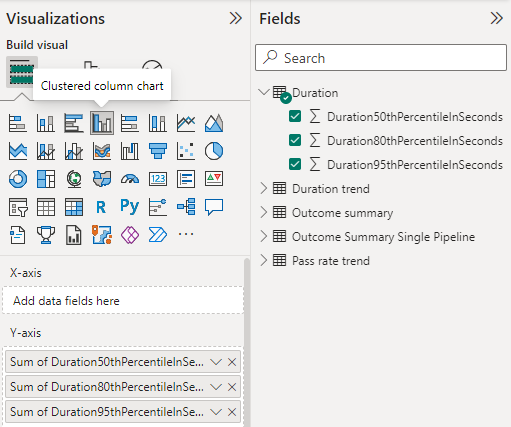
Power BI의 시각화 아래에서 클러스터형 세로 막대형 차트 보고서를 선택합니다. 이 예제에서는 이름이 바뀐 열이 없다고 가정합니다.

Y축에 다음 필드를 추가하고 각 필드를 마우스 오른쪽 단추로 클릭하고 합계가 선택되어 있는지 확인합니다.
Duration50thPercentileInSecondsDuration80thPercentileInSecondsDuration95thPercentileInSeconds
보고서 제목, 범례 또는 기타 보고서 시각적 개체를 변경하려면 시각화 창에서 시각적 페인트 브러시 서식 아이콘을 선택하고 하나 이상의 설정을 조정합니다.
보고서는 다음 이미지와 유사하게 표시됩니다.
