맵에 선 계층 추가
선 계층은 맵에서 LineString 및 MultiLineString 피처를 경로로 렌더링하는 데 사용할 수 있습니다. 선 계층을 사용하여 Polygon 및 MultiPolygon 기능의 개요를 렌더링할 수도 있습니다. 데이터 원본은 선 계층에 연결되어 렌더링할 데이터를 제공합니다.
팁
기본적으로 선 계층은 다각형의 좌표와 데이터 원본의 선을 렌더링합니다. LineString 피처만 렌더링하도록 계층을 제한하려면 계층의 filter 속성을 ['==', ['geometry-type'], 'LineString']으로 설정하거나 MultiLineString 피처를 포함하려는 경우에는 ['any', ['==', ['geometry-type'], 'LineString'], ['==', ['geometry-type'], 'MultiLineString']]으로 설정합니다.
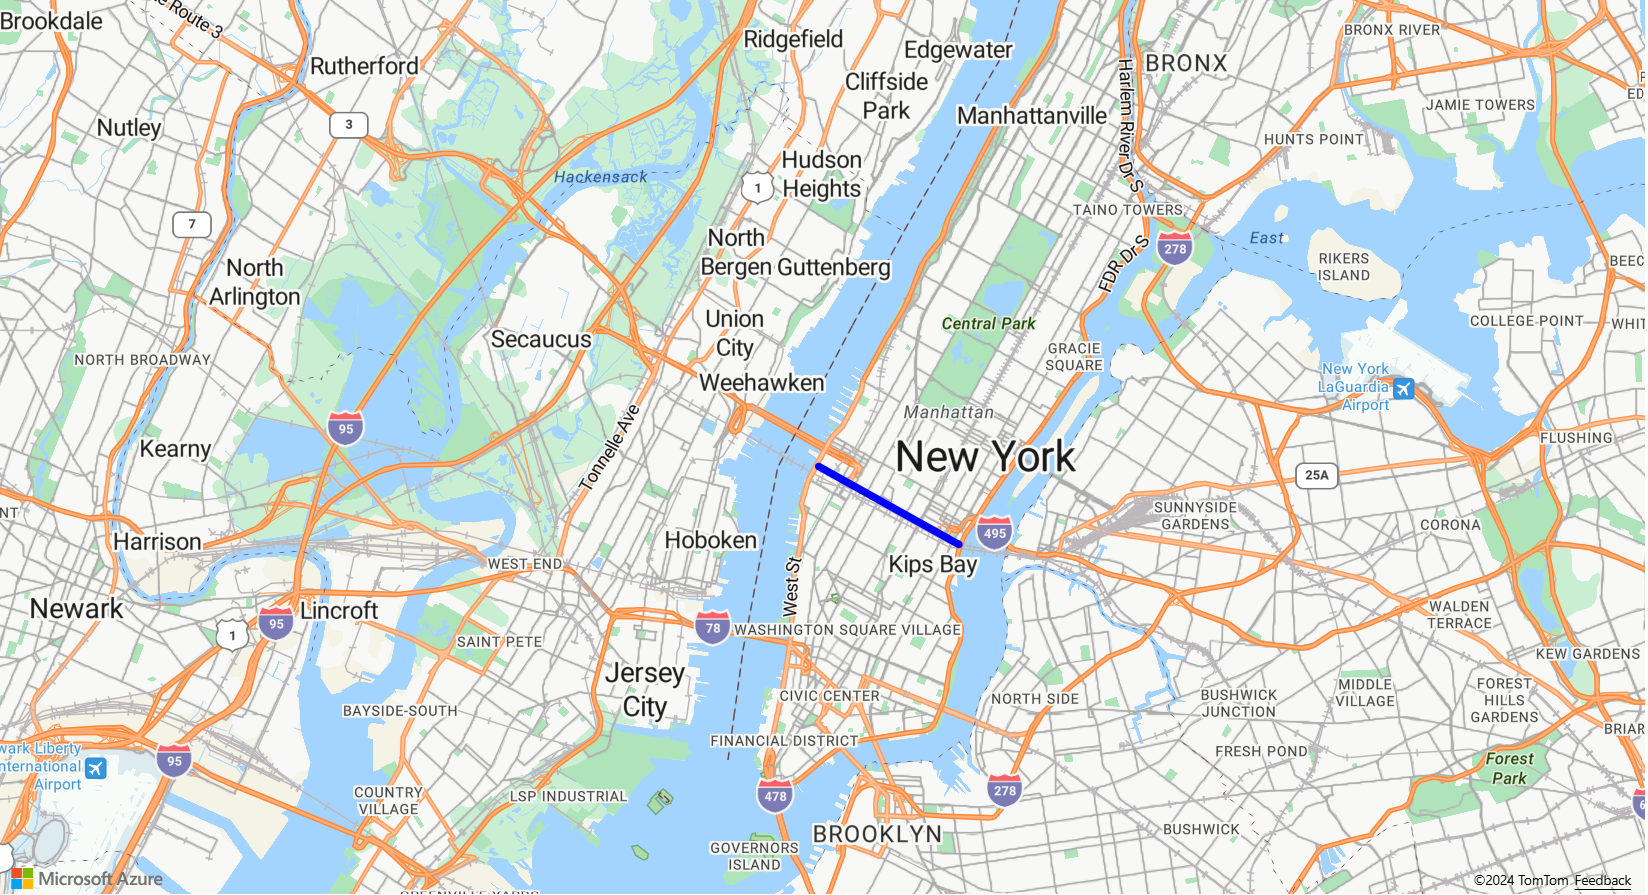
다음 코드는 선을 만드는 방법을 보여 줍니다. 데이터 원본에 줄을 추가한 다음, LineLayer 클래스를 사용하여 선 계층으로 렌더링합니다.
//Create a data source and add it to the map.
var dataSource = new atlas.source.DataSource();
map.sources.add(dataSource);

//Create a line and add it to the data source.
dataSource.add(new atlas.data.LineString([[-73.972340, 40.743270], [-74.004420, 40.756800]]));

//Create a line layer to render the line to the map.
map.layers.add(new atlas.layer.LineLayer(dataSource, null, {
    strokeColor: 'blue',
    strokeWidth: 5
}));
다음 스크린샷은 위 기능의 샘플을 보여 줍니다.
선 계층은 LineLayerOptions 및 데이터 기반 스타일 식 사용을 사용하여 스타일을 지정할 수 있습니다.
선을 따라 기호 추가
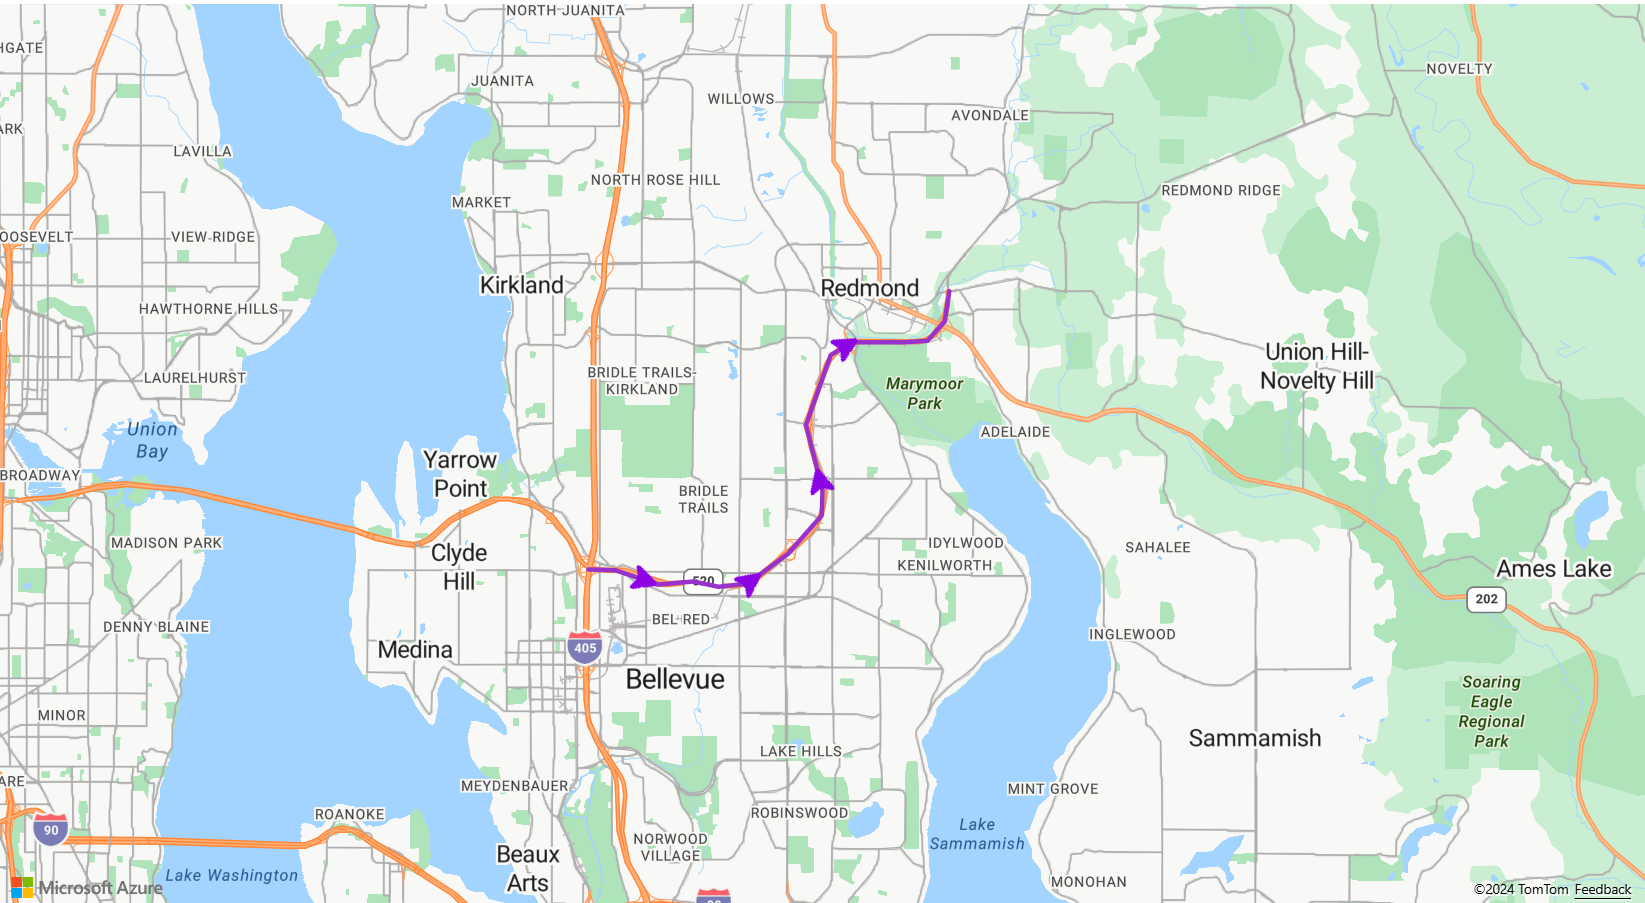
다음 샘플에서는 맵의 선을 따라 화살표 아이콘을 추가하는 방법을 보여 줍니다. 기호 계층을 사용하는 경우 placement 옵션을 line(으)로 설정합니다. 이 옵션은 선을 따라 기호를 렌더링하고 아이콘을 회전합니다(0도 = 오른쪽).
function InitMap()
{
    var map = new atlas.Map('myMap', {
    center: [-122.135, 47.65],
    zoom: 11,
    view: "Auto",

    //Add authentication details for connecting to Azure Maps.
    authOptions: {
      authType: 'subscriptionKey',
      subscriptionKey: '{Your-Azure-Maps-Subscription-key}'
    }
  });

  var datasource;

  //Wait until the map resources are ready.
  map.events.add('ready', function () {

    //Load the custom image icon into the map resources.
    map.imageSprite.add('arrow-icon', '/images/icons/purpleArrowRight.png').then(function () {
      //Create a data source and add it to the map.
      datasource = new atlas.source.DataSource();
      map.sources.add(datasource);

      //Create a line and add it to the data source.
      datasource.add(new atlas.data.Feature(new atlas.data.LineString([
        [-122.18822, 47.63208],
        [-122.18204, 47.63196],
        [-122.17243, 47.62976],
        [-122.16419, 47.63023],
        [-122.15852, 47.62942],
        [-122.15183, 47.62988],
        [-122.14256, 47.63451],
        [-122.13483, 47.64041],
        [-122.13466, 47.64422],
        [-122.13844, 47.65440],
        [-122.13277, 47.66515],
        [-122.12779, 47.66712],
        [-122.11595, 47.66712],
        [-122.11063, 47.66735],
        [-122.10668, 47.67035],
        [-122.10565, 47.67498]
      ])));

      //Add a layers for rendering data.
      map.layers.add([
        //Add a line layer for displaying the line.
        new atlas.layer.LineLayer(datasource, null, {
          strokeColor: 'DarkOrchid',
          strokeWidth: 3
        }),

        //Add a symbol layer for rendering the arrow along the line.
        new atlas.layer.SymbolLayer(datasource, null, {
          //Specify how much space should be between the symbols in pixels.
          lineSpacing: 100,

          //Tell the symbol layer that the symbols are being rendered along a line.
          placement: 'line',
          iconOptions: {
            image: 'arrow-icon',
            allowOverlap: true,
            anchor: 'center',
            size: 0.8
          }
        })
      ]);
    });
  });
}
이 코드는 다음과 같이 표시되는 맵을 만듭니다.
참고 항목
위의 샘플에 사용된 이미지 파일의 복사본은 GitHub의 purpleArrowRight.png 참조하세요.
팁
Azure Maps Web SDK는 기호 계층으로 사용할 수 있는 몇 가지 사용자 지정 가능한 이미지 템플릿을 제공합니다. 자세한 내용은 이미지 템플릿을 사용하는 방법 문서를 참조하세요.
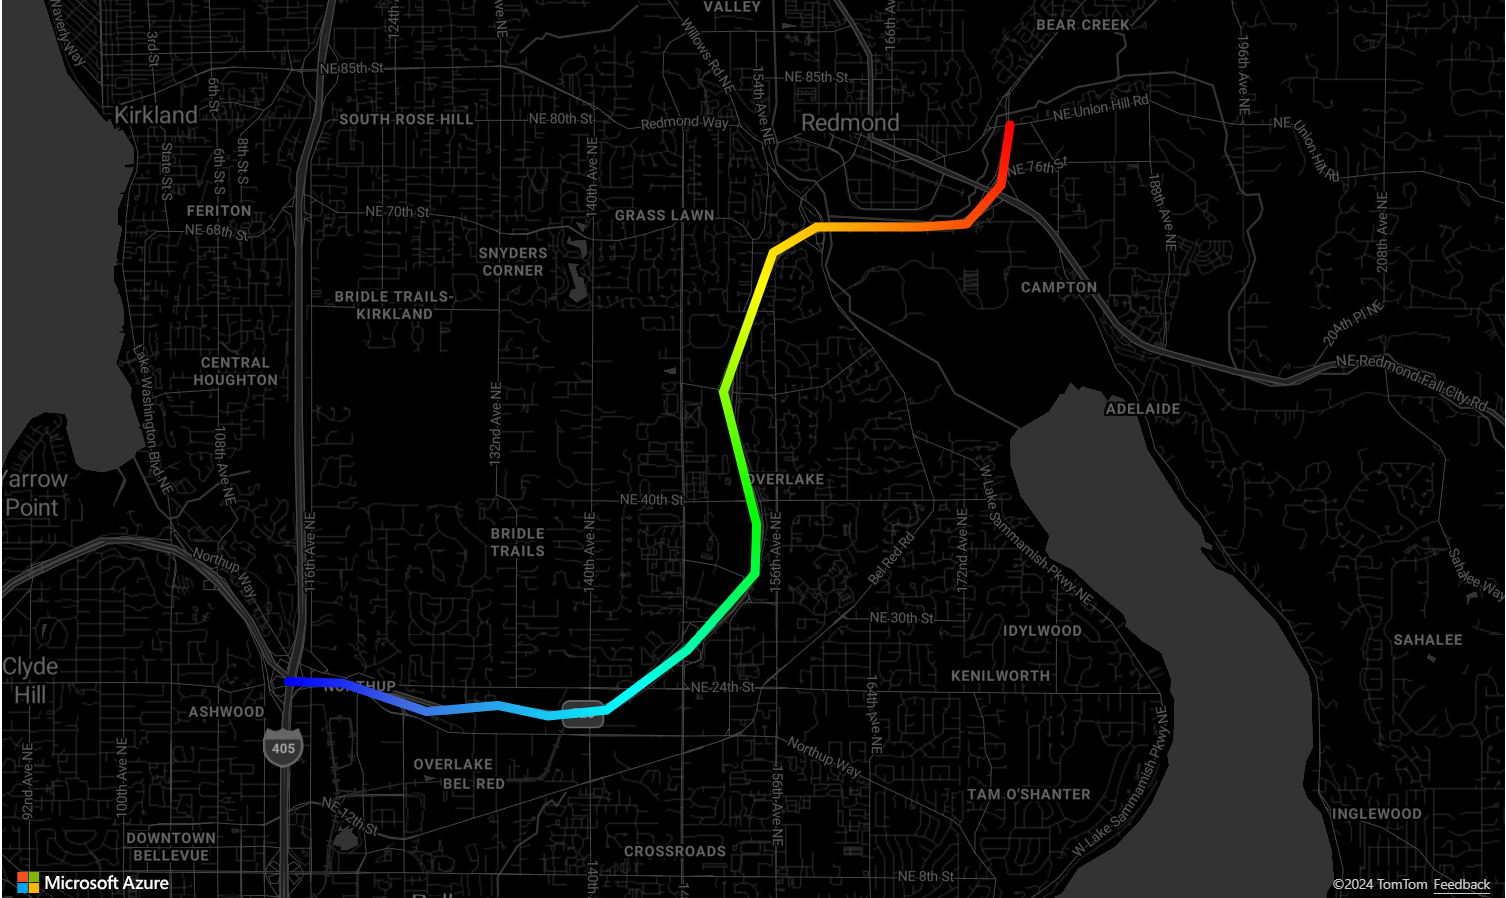
선에 스트로크 그라데이션 추가
선에 단일 스트로크 색을 적용할 수 있습니다. 색 그라데이션으로 선을 채워서 한 선분에서 다음 선분으로의 전환을 표시할 수도 있습니다. 예를 들어 선 그라데이션을 사용하여 시간 및 거리에 따른 변경이나 연결된 개체 선의 다른 온도를 나타낼 수 있습니다. 이 기능을 선에 적용하려면 데이터 원본에 lineMetrics 옵션이 true(으)로 설정된 다음 색 그라데이션 식을 선의 strokeColor 옵션에 전달할 수 있어야 합니다. 스트로크 그라데이션 식은 계산된 선 메트릭을 식에 노출하는 ['line-progress'] 데이터 식을 참조해야 합니다.
맵의 선에 스트로크 그라데이션을 적용하는 방법을 보여 주는 완전한 기능 샘플은 Azure Maps 샘플에서 스트로크 그라데이션이 있는 선을 참조하세요. 이 샘플의 소스 코드는 스트로크 그라데이션이 있는 선 소스 코드를 참조하세요.

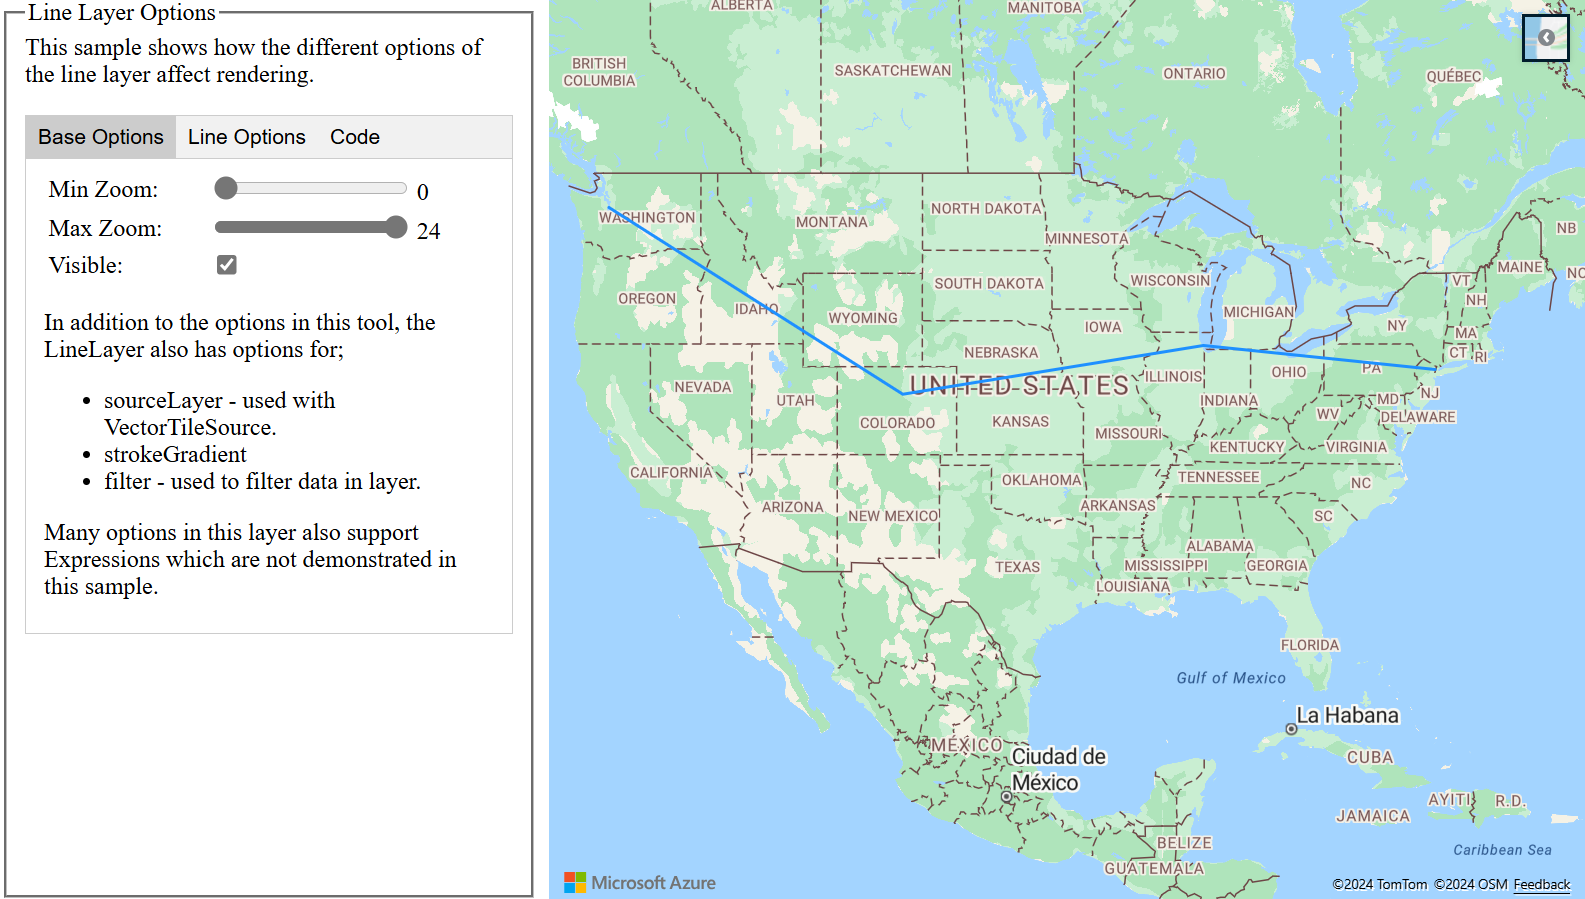
선 계층 사용자 지정
선 계층에는 여러 스타일 지정 옵션이 있습니다. 선 옵션을 대화형으로 보여 주는 완전한 기능 샘플은 Azure Maps 샘플의 선 계층 옵션을 참조하세요. 이 샘플의 소스 코드는 선 계층 옵션 소스 코드를 참조하세요.
다음 단계
이 문서에서 사용된 클래스 및 메서드에 대해 자세히 알아봅니다.
맵에 추가할 더 많은 코드 예제를 보려면 다음 문서를 참조하세요.


