Remote Desktop Services RDS Logon Connectivity Overview and Troubleshooting
Overview:
In supporting RDS, the two most common issues are the connection / reconnection process and licensing. This article is to document the RDP connection and licensing sequence that takes place for the most common RDP connection scenarios. All information provided is available through event logs and network tracing. Understanding the connection and licensing process should make troubleshooting a connection issue easier.
Covered in this Article:
- An overview of the connection sequence when you establish a direct RDP connection using NLA which is default.
- Network ports used in the RDP connection process.
- Details on what tracing and logging you can gather to troubleshoot RDP connection problems.
- Links to detailed trace and log information broken out by the type of tracing and by component.
Environment Configuration:
The environment that was used for testing unless noted differently in the specific scenarios sections is as follows:
- Azure RDS IaaS cloud only deployment
- All machines are Windows 2012 r2 with latest fixes at time of testing including the ‘client’
- All machines are on the same network and in same domain
- One forest and domain at 2012 functional level with one domain controller using Kerberos authentication
- All tests are using Remote Desktop Services role and not Remote Administration
- All tests use a single Windows 2012 RDS License server in per user mode
RDP connection scenario sequences:
- [[RDP Direct Connection Process with NLA Enabled]]
Items to Collect for Troubleshooting:
- Has anything changed?
- Is this a new configuration?
- Has this connection ever worked?
- Does this connection always fail?
- Time of issue if intermittent.
- If intermittent, is connection a new connection or a reconnect?
- Name of:
- user account
- client machine name and IP
- server machine name and IP
- session ID
- Client disconnect codes / reasons given on screen and in event logs.
- OS version and hotfix levels.
- Isolate issue as much as possible. Some examples:
- Specific user or user profile
- Specific client or server machine
- Specific OS or build
- Specific network
- Specific connection process (internal vs external)
Tracing and Logging:
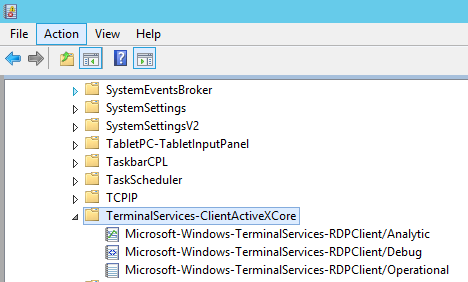
There are multiple Windows Event Logs that are valuable for troubleshooting RDS connectivity issues. This along with network tracing and sometimes process monitor can solve most of the common issues. Enabling 'Show Analytic and Debug Logs' will display the debug logs which will often provide better detail into an issue from the View menu option in Event Viewer. The debug logs can trace a lot of information and should only be used when actively troubleshooting an issue. All of the Event Logs being discussed are under the 'Applications and Services Logs/Microsoft/Windows' node in Event Viewer.
Event Viewer:
To show Analytic and Debug Logs:
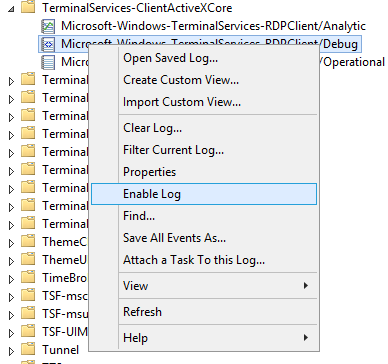
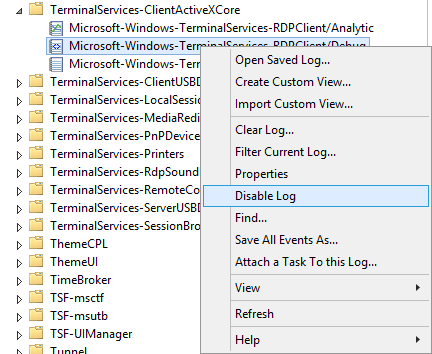
Once the Additional logs are displayed, the will most likely need to be enabled by right-clicking and selecting 'Enable log'.
These logs are not the typical .evtx event logs and real-time .etl logs that can capture more information. Though they are not typically associated with additional overhead, it is best to disable these logs when finished troubleshooting by selecting 'Disable Log'
Network:
For network tracing, Microsoft Network Monitor, Wireshark are often used, however, if just gathering a trace for later analysis, the easiest method is netsh. Netsh is built into the OS and therefore requires no download or install except the first time it runs it will add the packet driver to the network stack if it is not there.
Capturing a network trace:
Netsh has many switches to capture network traces and more. Here are example commands to start and stop a network trace using netsh from an Administrator command prompt that will capture a basic network trace. The trace max size will be 1 GB and will be circular. The output location is c:\net.etl:
To start a network capture:
netsh trace start capture=yes overwrite=yes maxsize=1024 tracefile=c:\net.etl filemode=circular
To stop a network capture:
netsh trace stop
After trace has successfully stopped which can sometimes take a while, use Network Monitor or Message Analyzer to view the trace. In the example above the file is c:\net.etl.
Most of the time all that is necessary from a network perspective is to check for general connectivity issues and SSL/TLS handshake issues. Common ports used by RDS such as 3389 -rdp, 443 -ssl/tls, 53 -dns, 389-ldap, 88 -kerberos,135 and ephemeral rpc. Connectivity errors due to authentication can be seen as well as a non-response.
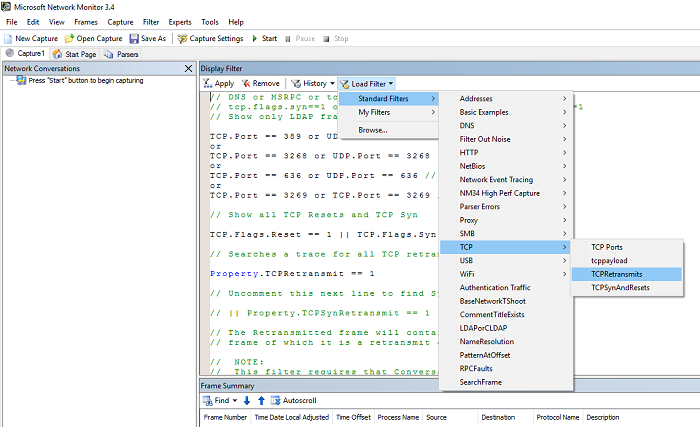
In example below, notice there are many predefined filters built into Network Monitor (as well as Message Analyzer). Using the predefined 'TCPRetransmits' and or TCPSynAndResets filters are useful for looking for connectivity problems.
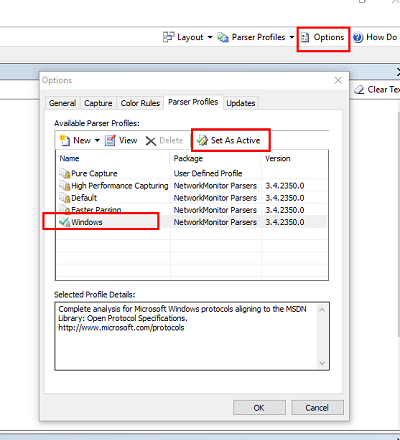
NOTE: To view network traces from netsh, you will need to set the 'Parser Profiles' active selection to 'Windows' from the 'Options' menu item in top right of window:
Troubleshooting:
Client:
Common items to check:
- Client version - more important if Windows 7 / 2008 r2. No widespread issues with any RDP client version 8.x or above.
- Local user / admin account - if domain account is failing, trying a local account is a good test and can rule out domain issues.
- Disabling NLA (Network Level Authentication) - by default this is enabled. If there are issues authenticating (client or server having issue communicating with a domain controller), disabling NLA as a requirement on the server AND setting enablecredsspsupport:i:0 in a test.rdp file.
- Mstsc /admin - mstsc /admin /v %ip address of 'server'% is a simple test. It will bypass brokering if environment is configured with a broker and will also bypass licensing. These are two big components that can be easily ruled out with this test.
- Network - checking basic network connectivity from client to server with ping, tracert, nslookup, telnet 3389 or powershell test-netconnection
- Firewall - At minimum TCP 3389 has to be open from client to server for a direct connection. If using an RD Gateway, additional ports such as TCP 443 are needed for connectivity as well.
- Event logs - see below
- Certificates - if using a trusted certificate for the RDP listener on the server, or if using a gateway, certificates can be a cause of connection issues.
- Hotfixes / rollups - It is best practice to apply current rollups as well as staying up to date with RDS specific hotfixes. see Reference below.
Network:
- TCP outbound port 3389
- UDP outbound port 3389 (optional depending on configuration)
- SSL / TLS TCP 443
- DNS port 53
- DS port 445
- LDAP port 389
- Kerberos port 88
Windows Event Logs:
- Microsoft-Windows-TerminalServices-ClientActiveXCore
- Microsoft-Windows-TerminalServices-RDPClient/Analytic
- Microsoft-Windows-TerminalServices-RDPClient/Debug
- Microsoft-Windows-TerminalServices-RDPClient/Operational
Common RDP client errors:
There are many client errors that can be displayed and logged into the event logs that are useful for troubleshooting.
[[RDS Remote Desktop Client Disconnect Codes and Reasons]]
RDSH Server:
Common items to check:
- Licensing
- Netstat
- mstsc /v localhost
- RDP Listener
- Services
- Firewall
- Hotfixes / rollups
Network:
- TCP RDP inbound port 3389
- UDP RDP inbound port 3389
- RPC ephemeral outbound for RDS License Server
- TCP outbound port 135
- DNS port 53
- LDAP port 389
- DS port 445
- Kerberos port 88
Windows Event Logs:
- RemoteDesktopServices-RdpCoreTS/Operational
- RemoteDesktopServices-SessionServices/Operational
- TerminalServices-LocalSessionManager
- Analytic
- Debug
- Operational
- TerminalServices-RemoteConnectionManager
- Analytic
- Debug
- Operational
Common RDSH Server errors:
- Authentication
- Certificates
- Schannel encryptions and ciphers
- Domain controller connectivity
- Licensing
[[RDS Session Host Server Disconnect Codes]]
RDS License Server:
Common items to check:
- Client Access Licenses (CAL's) available
- Services
- Firewall
- Trusts
- Group Membership
- Hotfixes / rollups
Network:
- TCP inbound rpc ephemeral
- TCP inbound port 135
- DNS port 53
- LDAP port 389
- DS port 445
- Kerberos port 88
Windows Event Logs:
- System
- Security
Common RDS License errors:
- TerminalServices-Licensing 4105 – The Terminal Services license server cannot update the license attributes for user “<UserName>” in Active Directory Domain “<DomainName>”
- RPC connection failures can be seen in the Security Event Log of the License server. The RDS Server authenticates to the License server as itself. In multiple domain / forest setups there can be configuration issues that cause this authentication to fail.
Tools:
Logman
Built into OS. Gives the ability to enable / disable Debug and Analytic Event logs from command line.
Message Analyzer
Microsoft Message Analyzer is an ETW /ETL file viewer that can be used to view netmon/netsh network traces.
http://www.microsoft.com/en-us/download/details.aspx?id=44226
Network Monitor
Microsoft Network Monitor 3.4 (archive) Network trace file viewer that can be used to view netmon/netsh network traces.
http://www.microsoft.com/en-us/download/details.aspx?id=4865
NetSH
Netsh is built into the OS and therefore requires no install but is only command-line based.
To capture a network trace: netsh trace start capture=yes overwrite=yes maxsize=1024 tracefile=c:\net.etl filemode=circular
To stop a network trace: netsh trace stop
To view a network trace: Use Network Monitor or Message Analyzer
Process Explorer
Used to view process information, such as utilization, thread utilization, handles, dlls.
Process Monitor
Used to trace out certain events such as registry read / writes, file read / writes, network connectivity, and system events like thread start.
Reference
Welcome to Remote Desktop Services (MSDN Remote Desktop Services Overview)
Azure desktop hosting - Reference architecture and deployment guides
Windows 2012 Capacity planning guide
[[articles:RDS 2012: Which ports are used during deployment?]]
Available Updates for Remote Desktop Services in Windows Server 2012 R2
Remote Desktop Services Blog
Remote Desktop Services Forums
RDS 2012 Session Host deployment scenarios
RDS 2012 session deployment scenarios Server Role Deployment
Guidelines for installing the Remote Desktop Session Host role service on a computer running Windows Server 2012 without the Remote Desktop Connection Broker role service Best practices for setting up Remote Desktop Licensing (Terminal Server Licensing) across Active Directory Domains/Forests or Workgroup
RD Licensing Configuration on Windows Server 2012
Specify a License Server for an RD Session Host Server to Use
Troubleshooting Remote Desktop Licensing Issues
[[articles:Remote Desktop Licensing Demystified]]

