IIS: Application Insight Integration
Introduction
You have an existing on-prem/cloud environment in which you are running your enterprise application and want to use Application Insight to capture telemetry?? Then with few simple steps, configure your server and get ready to go with Application Insights shortly.
Click here to learn about Application Insights.
Click here for creating an Application Insight from Azure Management Portal.
Follow the below steps now
Step – 01
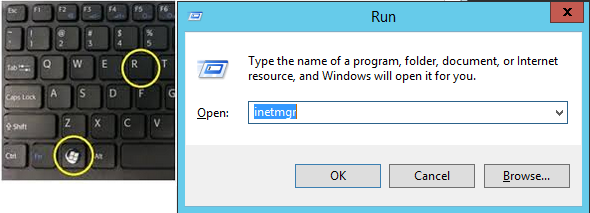
Open IIS manager by pressing “Windows + R” button, type in “Inetmgr” and click OK.
Step – 02
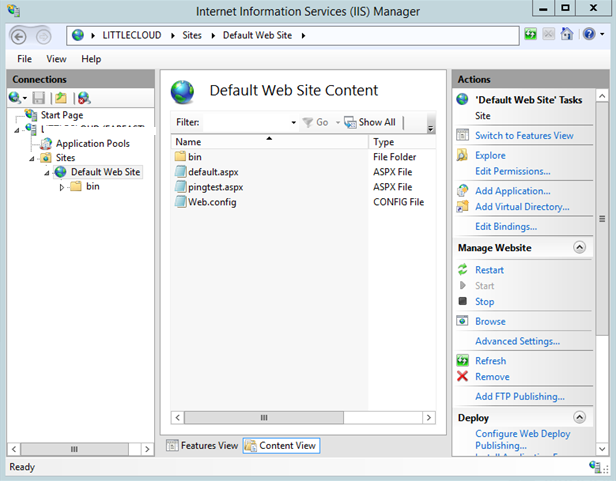
In IIS Manager, click on “Default Web Site” and “Content View” at the bottom to verify the files are there.
Step – 03
To configure this server to use Application Insight, we would need to install the “Application Insights Status Monitor” on the server. Click on the link below to download and install it:
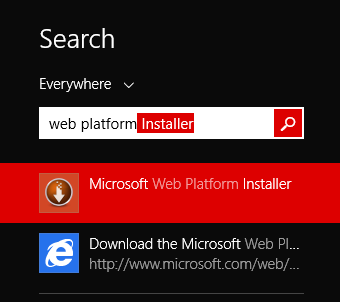
You can also install it from “Web Platform Installer”. Open the WebPI from Windows search by pressing “windows” button and just type “Web platform Installer”.
Step – 04
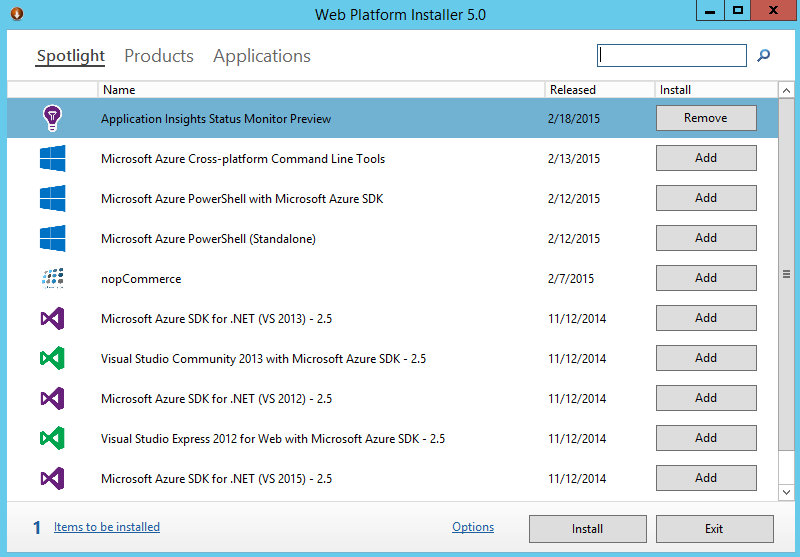
In the WebPI window, type in “Application Insights” in the server option. Select “Application Insights Status Monitor Preview”, Click on “Add” and “Install”
After installing, launch the “Application Insights Status Monitor” and “Sign In” with the Azure account provided to you:
Step – 05
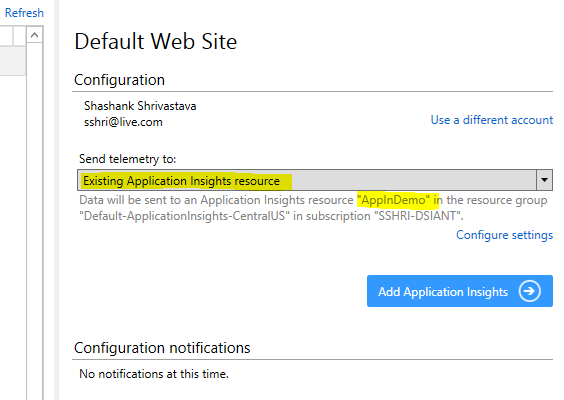
After signing in, the “Application Insights Status Monitor” will show the list of Application Insight Resources. Select the resource you created in by the time of creating Application Insight and click the button “Add Application Insights”:
It will take few seconds to configure the website to use “Application Insights” and will prompt for restarting IIS:
After restarting IIS, the website status will turn to “Enabled” and it will start logging telemetry data to “Application Insights”.
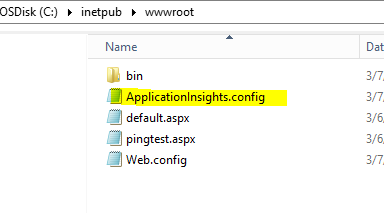
The Application Insights Status Monitor agent places “ApplicationInsights.config” configuration file under your website directory and adds some configuration settings in Web.config file:
Step – 06
Now browse the following URL in browse tabs to start logging some telemetry data:
http://localhost/pingtest.aspx
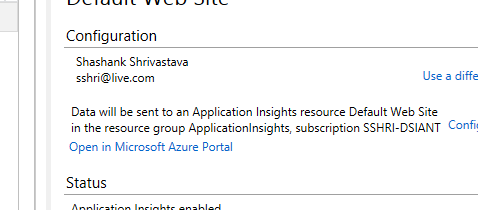
Now switch to “Application Insight status monitor” and click on “Open in Microsoft Azure Portal”
Step – 07
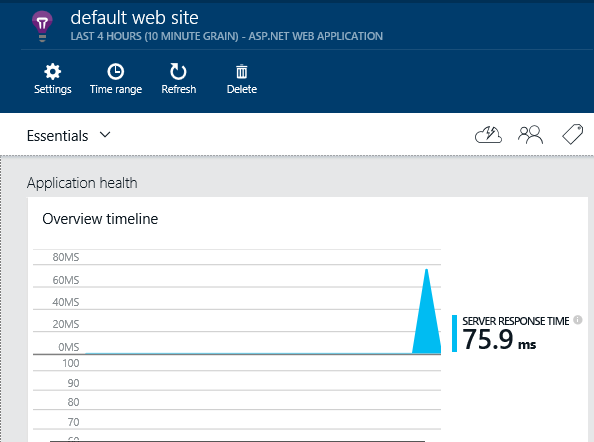
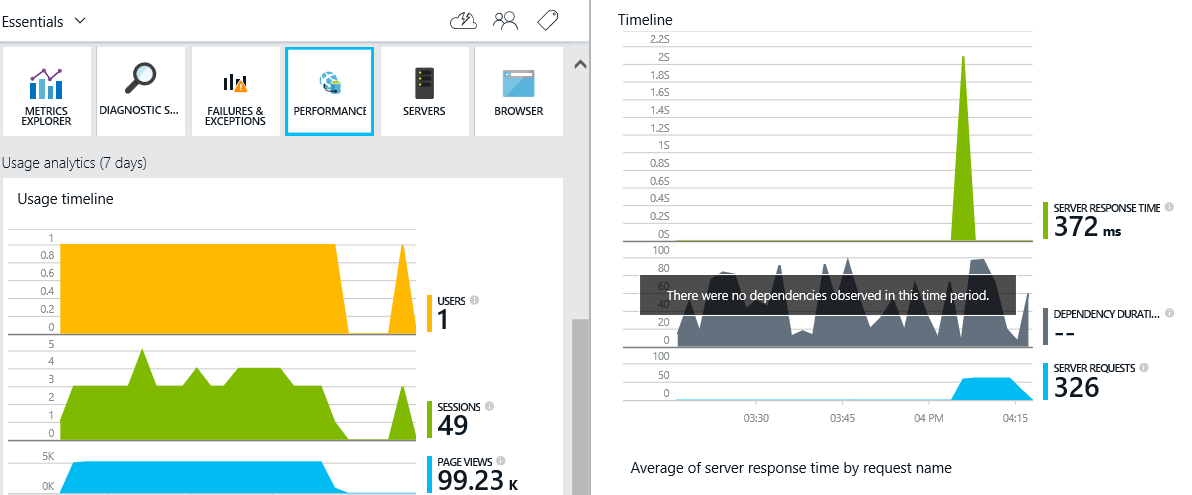
Login to the portal and it will open the Application Insights resource in which we are logging the server’s telemetry data:
Summary
This Application Insight will help you to track the performance and usage of web application that has been hosted on Microsoft Azure Service. You can also track adoption and usage with pages, events and metrics.
We will be working with Application Insights attaching towards existing ASP .NET Web application in future posts.
