Project Online and Reporting
Introduction
Reporting is one of the most important part of a Project and Portfolio Management system.
With Project Online, the way to build and publish report has changed. It can be difficult to find complete documentation about this topic.
This post has been written to help readers to build their Reporting solution for Project Online. Not all the details will be given, but the purpose is to draw the big picture of the solutions, with some practical advices based on real world experience in Project Online deployment for Customers.
Your contributions
This article belongs to the community. The initial version is not complete, and your contributions are really welcome
Project Online
Project Online is the Office 365 service proposed by Microsoft, designed to manage Projects and Portfolios (PPM).
With Project Online, companies can manage their projects with Project Server, without supporting the maintenance cost of a multitier infrastructure.
Users continue to use Project Pro (for Project Leader) or PWA (for all other users): there is no difference for them.
For Project Administrators, there are some differences to take into account:
- Customization: with Project Server, it is possible to use PSI to create extensions (server event handler, enhanced statusing form…). With Project Online, PSI is not allowed, developer must use the client side object model (CSOM)
- Reporting: with Project Server, we have access to both relationnal database, or OLAP database to get data. Reports can be developed with SQL Server Reporting Services (SSRS). With Project Online, there is no access to the Database: we have to get the data through another way. This point will be developed in the next chapters.
For a complete list of differences between Project Online and Project Server 2013, follow this link: http://technet.microsoft.com/fr-FR/library/dn268595(v=office.15).aspx
The examples below will be based on our Project Online demo tenant. If you don’t have one, let a comment to see how we could do.
Project Online and Data Access
Principle
With Project Online, there is no possibility to execute T SQL statement and get data from relational database, or Analysis Services database. Because we are in a cloud architecture, this limitation is easy to understand.
The solution to get data from your Project Online platform is OData.
OData
The simplified definition of OData is: The Open Data Protocol (OData) enables the creation and consumption of REST APIs, which allow resources, identified using URLs and defined in a data model, to be published and edited by Web clients using simple HTTP messages.
It means that you have to send HTTP message, and you get your data. For example, if our Project Online URL is https://YOURTENANT.sharepoint.com/sites/pwa, we have to add /_api/ProjectData/Projects to get the list of projects.
The basics of OData for Project Online
By typing https://YOURTENANT.sharepoint.com/sites/pwa/_api/ProjectData/Projects (replace YOURTENANT by your tenant name) in the URL of Internet Explorer, you will get something like that (I reduced the number of fields to simplify).
<?xml version="1.0" encoding="utf-8" ?>
- <feed xml:base="https://YOURTENANT.sharepoint.com/sites/pwa/_api/ProjectData/" xmlns="http://www.w3.org/2005/Atom" xmlns:d="http://schemas.microsoft.com/ado/2007/08/dataservices" xmlns:m="http://schemas.microsoft.com/ado/2007/08/dataservices/metadata">
  <id>https://YOURTENANT.sharepoint.com/sites/pwa/_api/ProjectData/Projects</id>
  <title type="text">Projects</title>
- <content type="application/xml">
- <m:properties>
  <d:ProjectId m:type="Edm.Guid">32988321-c6be-e111-9f1e-00155d022681</d:ProjectId>
  <d:EnterpriseProjectTypeName>Software Development</d:EnterpriseProjectTypeName>
  <d:ProjectAuthorName>i:0#.f|membership|admin@YOURTENANT.onmicrosoft.com</d:ProjectAuthorName>
  <d:ProjectDescription>Helps users evaluate their intake, exercise, and lifestyle behaviors to produce an action plan to discuss with a doctor. Offers a “health-o-matic” meter to measure the user’s health status.</d:ProjectDescription>
  <d:ProjectDuration m:type="Edm.Decimal">3257.998333</d:ProjectDuration>
  <d:ProjectName>Health Assessment Reporting Tool</d:ProjectName>
  <d:ProjectOwnerName>Sara Davis</d:ProjectOwnerName>
  <d:ProjectPercentCompleted m:type="Edm.Int16">25</d:ProjectPercentCompleted>
  </m:properties>
  </content>
Projects, and what else ?
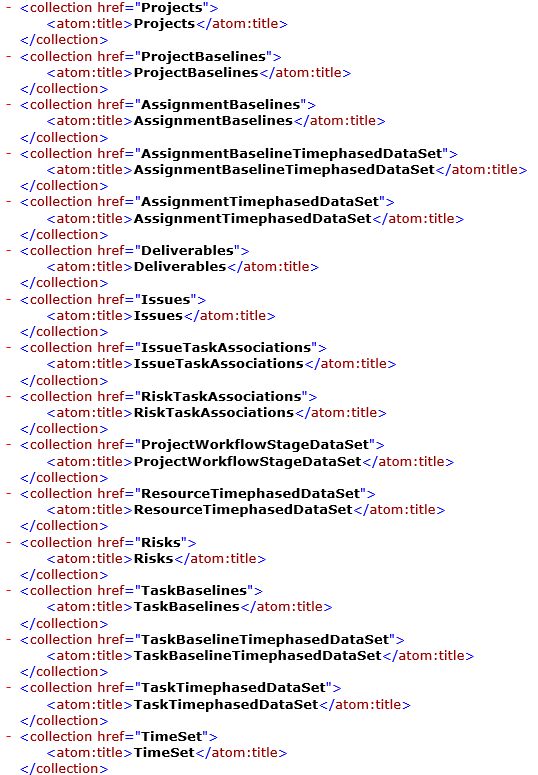
In the previous example, we asked for Projects. There are many other entities: to get the list of entities, simply type:
https://YOURTENANT.sharepoint.com/sites/pwa/_api/ProjectData
Be more selective
When we asked for Projects data, we received a lot of information about the projet. There are more or less 100 fields in the Project entity: basically, we don’t need all the details !
We can use OData query language to select specific fields, to filter data, or order the resultset. This example selects only some fields of the project, thanks to the $select clause.
For more information about OData querying:
- General info on MSDN: http://msdn.microsoft.com/en-us/library/office/jj163015(v=office.15).aspx
- Querying OData for Project 2013: http://msdn.microsoft.com/en-us/library/office/jj163048(v=office.15).aspx
- OData ReportingData: http://msdn.microsoft.com/en-us/library/office/jj163529(v=office.15).aspx
Consuming OData
Now that we can get data from Project Online, we need a solution to create reports. The immediate solution is to use a well known Microsoft Product: Excel !
Excel will allow us to:
- Defining the different OData datasources
- Using Power Pivot to create relations between entities
- Using Pivot Table, graphical, tables or Power View to create reports
Initializing Excel
The next examples will use Power Pivot. It’s an Excel Addin: you should verify if the Addin is activated. This Addin is installed with Excel 2013 in the Professional Plus edition.
For Excel 2010, Power Pivot can be downloaded and installed: Bing or Google should find the URL.
Often, Power Pivot and Power View are not activated. To activate them, go to the Excel Backoffice, and Manage COM Addins.
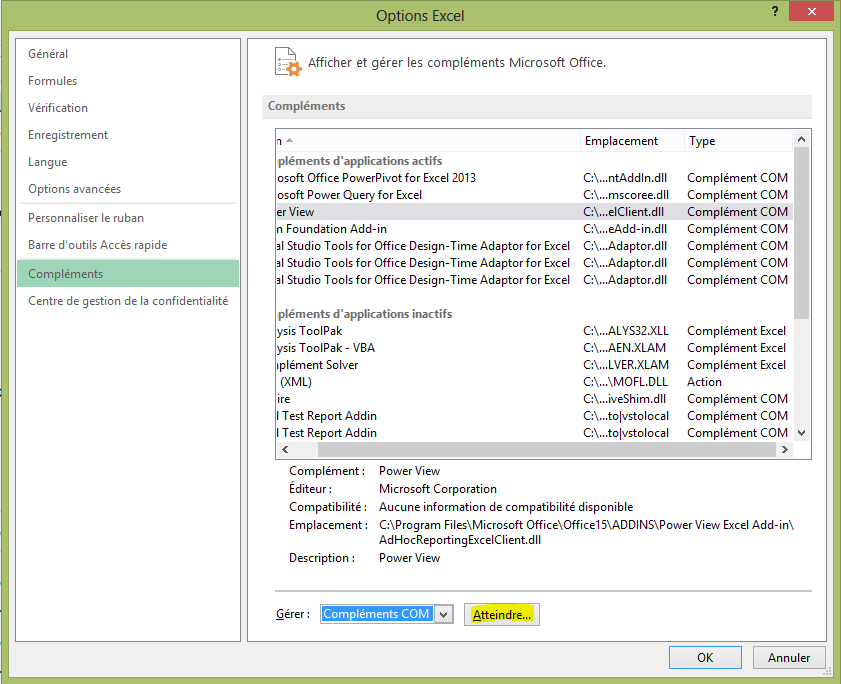
After activation, the Addins should be present in the ribbon.

Create the Datasource
Before integrating the Datasource in the Excel Report file, you should design and code your OData query. Keep in mind that each field will generate a significative volume of data, especially for entities like Tasks, Assignments, or Timephased data. In this last case, each field must be carefully weighted, because the field will be added to each row: only relevant fields must be queried, if you want to keep acceptable response time.
In our example, we willl stay simple: the previous Projects query, with some fields. You can check the result in the navigator. Please note the you have to desactivate an option in Internet Explorer, if you want to see the XML Data in the Browser. The RSS Feeds must not be read by the browser (Option / Content / Advanced / Uncheck Activate RSS Feed readmode)
https://YOURTENANT.sharepoint.com/sites/pwa/_api/ProjectData/Projects?$select=ProjectId,ProjectName,ProjectActualWork,ProjectFinishDate,ProjectRemainingWork,ProjectWork
If you’re happy with your OData query, it’s time to integrate it in your new Excel Report, created in a new Excel workbook.
In your new workbook, go to Data, and insert an Other Data Source, and select OData.
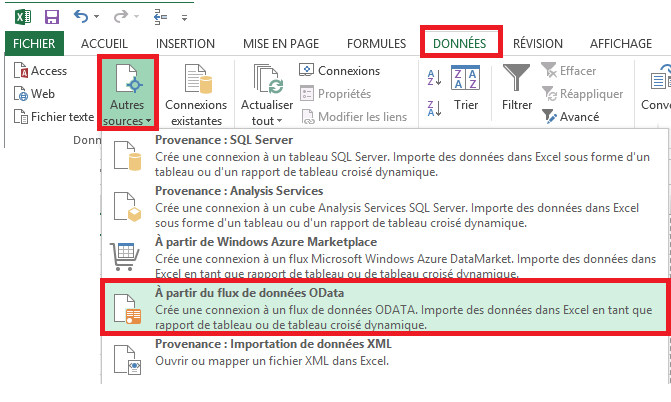
In the dialog box, paste your OData query.
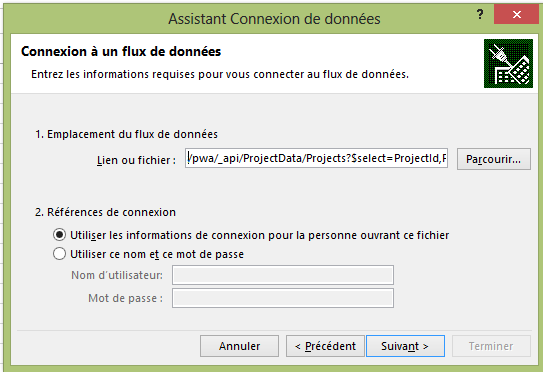
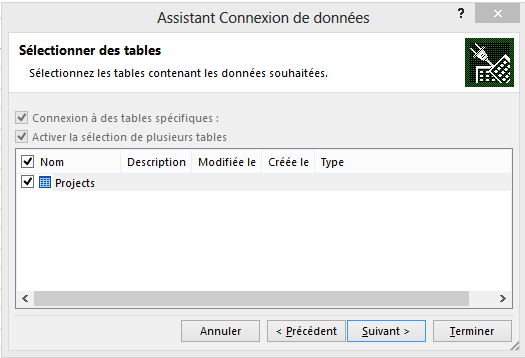
The table Projects is proposed: we can accept it.
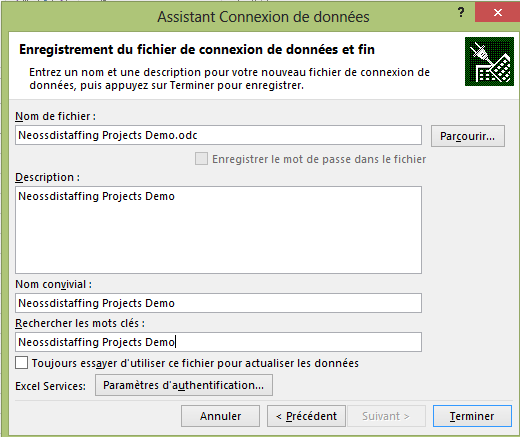
We can give an explicit name to the connection, and to the ODC file (Office Data Connection).
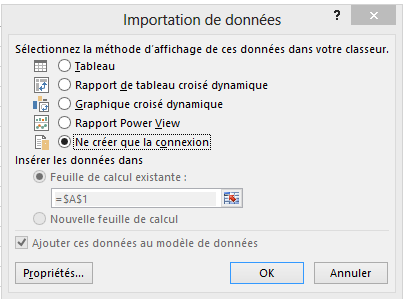
We can choose now how to use the data:
- Table: the data will be displayed in a new Table in the current workbook
- Pivot Table: the data will be added in a pivot Table, to perform manalysis
- Graphical Pivot Table if we want to display graphics
- Power View Report
- Only connection creation
In all of the cases, the data will be added in the Power Pivot datamodel: this will be the most interesting thing. In practice, in the most often case, we will choose the last option, because we will need to enhance the model, by adding other entities like tasks, resources or assignments before drawing the report.
Enhance the Data Model
If you select the Power Pivot tab, you can access to the data model.

If you click on Manage, the very simple Datamodel is displayed. It does only contain one table: Projects. The data are displayed as if we were in a normal Excel sheet. But be aware that we are in Power Pivot. In fact, the data are cached into the Excel file, even if they are not present in an Excel sheet.
From here you can modify the model, by adding calculated columns. One common operation should be to add a Work in Days, or to have column with a more user friendly name.
By clicking on the last column, you can add a formula, in the DAX language. In this example, we will calculate the Project Work in days, by dividing by 8.
Help on DAX expressions can be found here: http://msdn.microsoft.com/fr-fr/library/gg399181.aspx or event better, in the DAX Resource Center.
Note that there are a lot of assistance to build you queries in the formula bar.
Another possibility is to hide some technical column for clients: for example ProjectId should not be shown in the Excel sheets. A simple right click will propose this option.
Create relationships
The main benefit of Power Pivot in Project Online context is the possibility to create relations between related entities. Because OData query will only propose to get data table by table, we are loosing the relations that would be present in the Relational Datamodel in SQL Server. Even if OData query can give access to navigation between related table (expand, parent, etc…), it’s more difficult than a INNER JOIN…
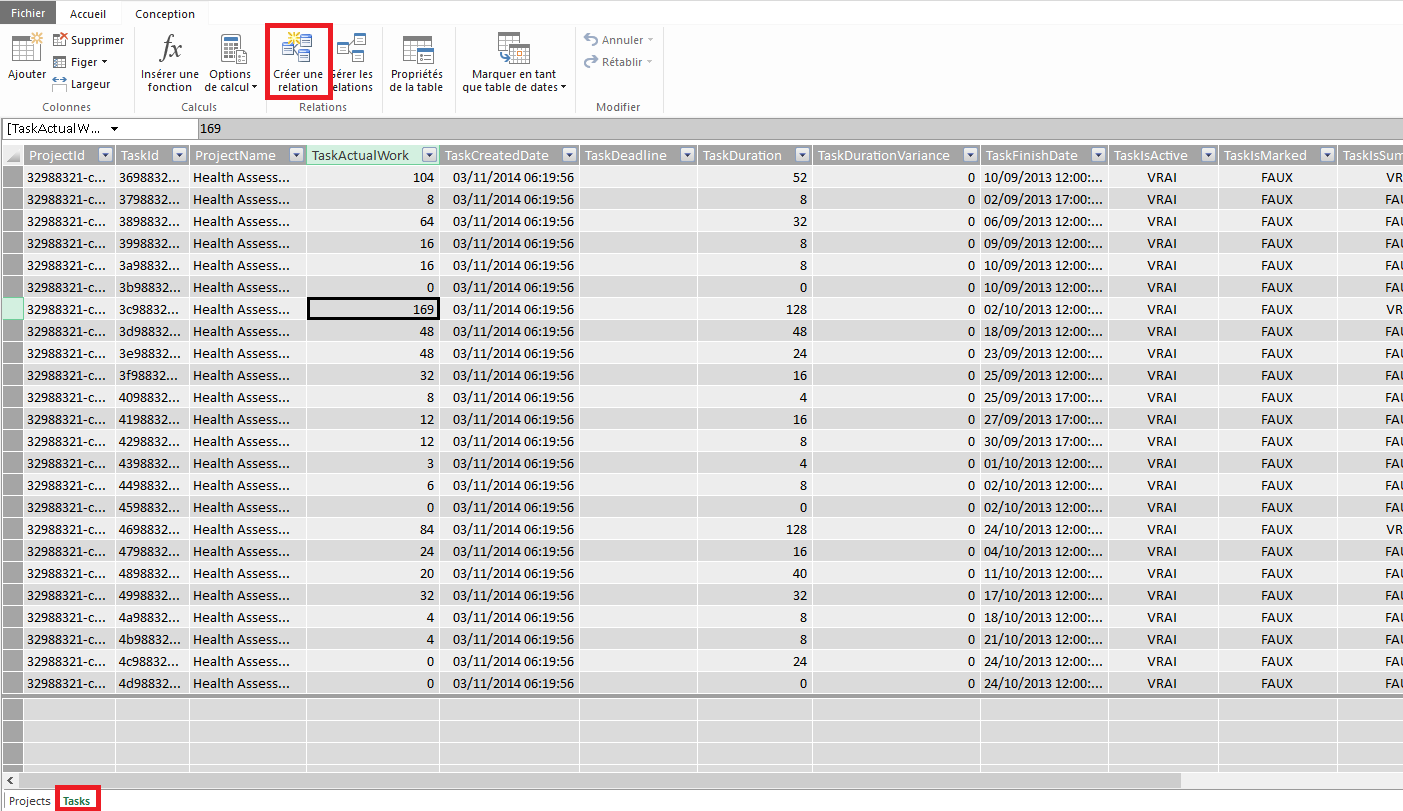
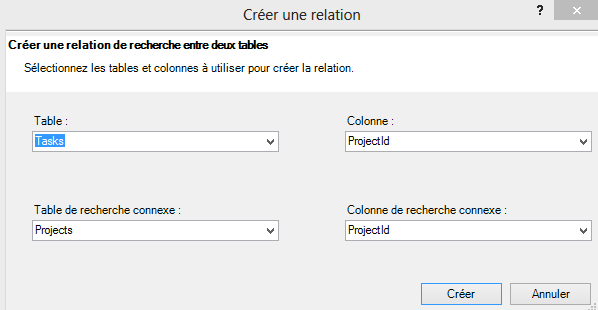
One usage example is to get the Tasks by Project. To make it, we have to add the Tasks table in the datamodel, and add a relation between the 2 tables, through the ProjectId key.
To establish this relation, we have to:
- From Excel (not in Power Pivot), add the Tasks table in the Data Model: create the connection in the same way as we did with Projects, by pasting the OData query. In our case, it should be: https://YOURTENANT.sharepoint.com/sites/pwa/_api/ProjectData/Tasks?$select=ProjectName,TaskCreatedDate,TaskStartDate,TaskFinishDate,TaskDuration,TaskDeadline,TaskName,TaskIsActive,TaskIsMarked,TaskIsSummary,TaskActualWork,TaskWork,TaskDurationVariance,TaskWorkVariance,ProjectId,TaskId
- Create the relation
The model is now complete: it’s time to use the report in Excel.
Additional information about Power Pivot can be found here: http://msdn.microsoft.com/fr-fr/library/gg413497(v=sql.110).aspx
Project Online Reporting
If we return on Excel, the worksheets are empty: we did only work with the Power Pivot model.
We will now consume this datamodel to create report tables and graphical reports. There are different ways to create this reports.
Simple table
If we want to consume only data from a single table, we can use standard Excel tables. To insert such a table, simply go to Data / Existing Connections / Tables
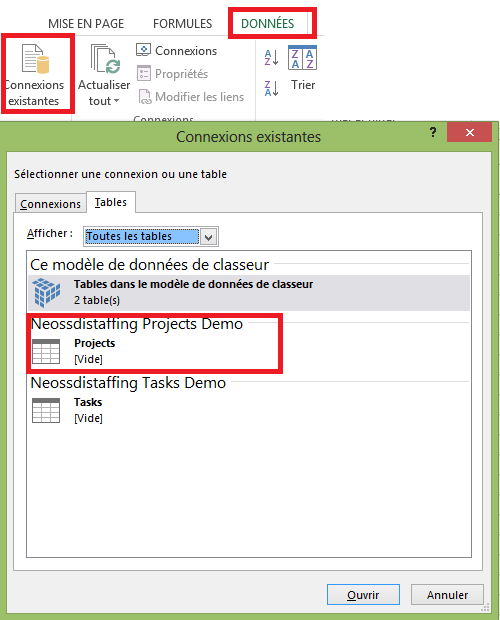
After that, you will have a simple tabular view of your data, where you could make conditional formatting, using databars, smileys, etc…From here it’s standard Excel knowledge.
Pivot Table
Very often, the reports must display data from many tables. You can create pivot tables to achieve this kind of report. To create this report, in the previous Existing Connection dialog box, select “Tables in the Datamodel”. After the model is declared in this worksheet, you can drag and drop each field, regardless the table it belongs.
Graphical Reports
It’s easy from this data to create graphical: again, it’s standard Excel usage. You can use slicers, bar graphs, etc…All the power of Excel is available build very powerfull reports.
Publishing Reports
The reports produced with Excel can be shared in the organisation through Excel Online.
We only have to save the Excel Report in SharePoint Online to make it available for the company.
A good place to publish reports will be the Reports part of Project Online.
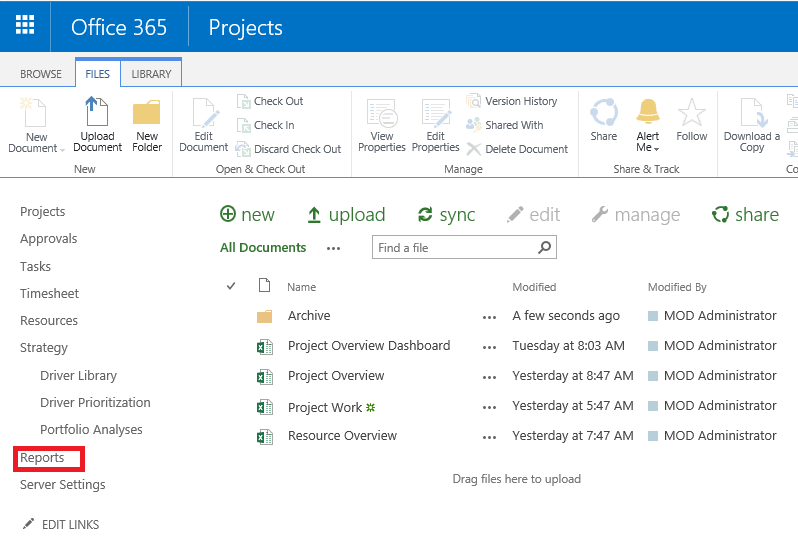
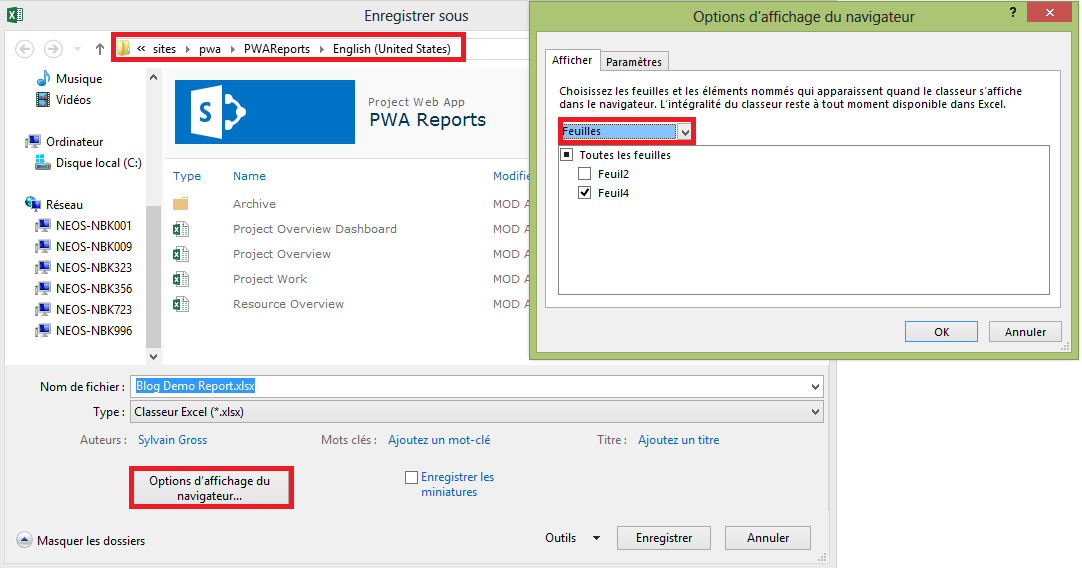
Your new report can be dragged and Dropped in a SharePoint folder in the BI Center. Alternatively, you can save it from Excel, and modify the display option (selection of displayed sheet, parameters…).
If you return in the library, and you click on the report, it will directly be displayed in an Excel Viewer.
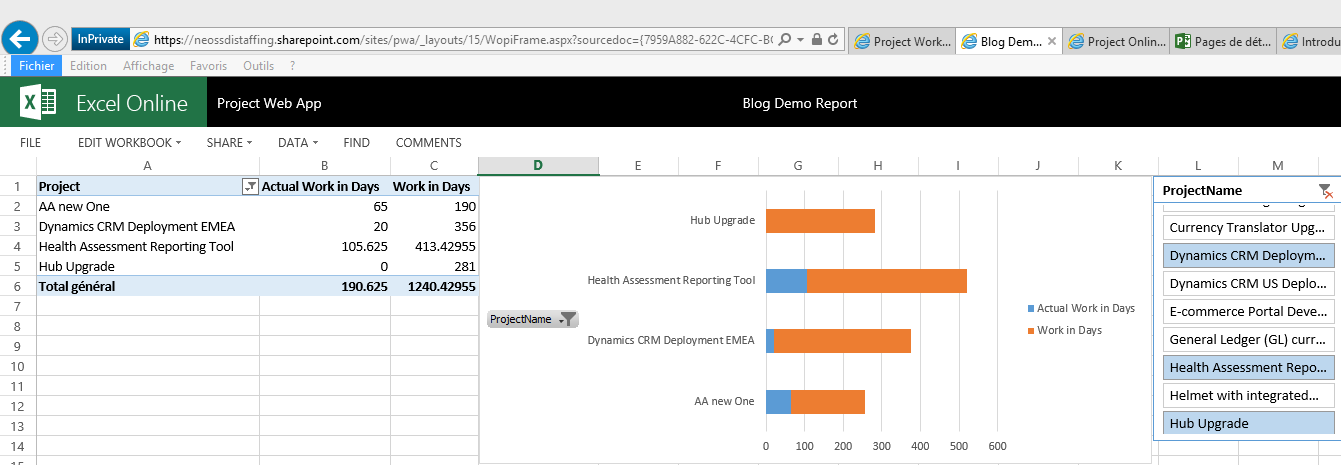
The report can also be displayed in another site: you just have to add a Excel Viewer webpart to your page, and the report will be available in the site. A good practice is to let the Excel document in the BI Center, and to display it through this webpart: it’s better than copying the report on each site !
Refreshing Reports
Of course a report is not aimed to be static: the data should change. There are different options:
- Manual update from Excel: it’s necessary to load the file, update through the Refresh All command, and save the updated file
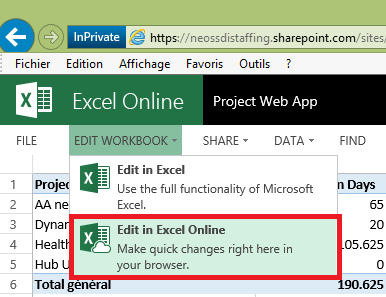
- Manual update from Excel Online: the process is the same, except that you don’t have to load the file in Excel. Don’t forget to Edit the workbook before asking for the Refresh, otherwize the Refresh operation will not modify the Excel File, but just the page
- Auto Refresh update, with Power BI. It’s on optionnal service of Office 365: at least one person must subscribe to the service to use Power BI.
Manual Update
In Excel, the process is obviuous: Open the file, clic on Refresh, and save the document. The data will be updated.
In Excel Online, first you must Edit the file:
After that, you can Refresh All Connections
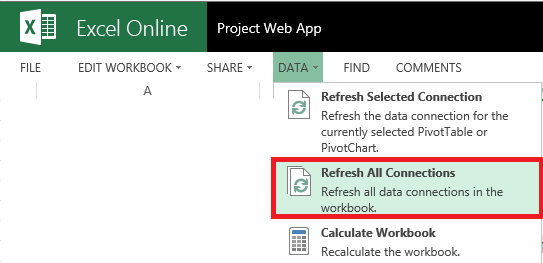
A warning will ask you to confirm, because of security risks. After confirmation, the report is grayed while the report is being refreshed. Note that the execution time can not exceed 10 minuts, otherwize you will get a timeout error. Microsoft support confirmed that this timeout duration cannot be changed in Office 365 for a specific tenant.
The data are then updated for all users.
Please note that a feature must be activated in your PWA collection: Project Web App Permission for Excel Web App Refresh.
To activate this feature, go to Site Settings / Site Collection Feature and activate it.

Go further in Reporting Design
Some very interesting reporting material is available here: Project Online Reporting Pack / Solution Starter
Automatic Update in Power BI
Manual update off reports is not very convenient if you have a lot of reports. There is a risk of un refreshed report, showing old data.
A solution exists to update the reports automatically: Power BI.
Power BI is a complete Microsoft offer, to help companies to give value to their data. The different modules are:
- Power BI Sites for centralizing and sharing Reports and data connection
- Gateway management for helping you to expose your On Premise data to internet, in OData format. This allows you to build reports with both On Premise data, and Cloud data
- Power BI Q&A for querying your data with natural language
The official link to Power BI is: http://www.microsoft.com/en-us/powerBI/default.aspx
In our case, we only use Power BI Sites
When Power BI is activated in your Office 365 tenant (you can request a trial period on your existing Office 365 platform), you will have Power BI in your Site Content.

If you click on Power BI, you will be moved to another site: the Power BI Site.
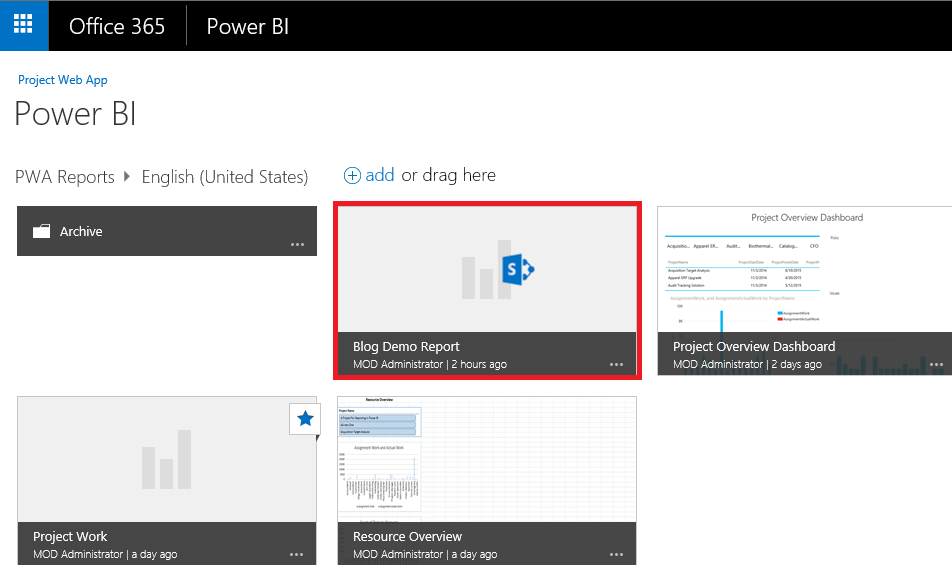
This site will analysing your collection, and display its content. You will see different Folders: PWA Data Connections, PWA Reports, etc…All the content of the BI Center will be shown.
Our report is stored in the PWA Reports folder.
A SharePoint icon is displayed over our report. It means that this report has not been Enabled in Power BI. So let’s make it:
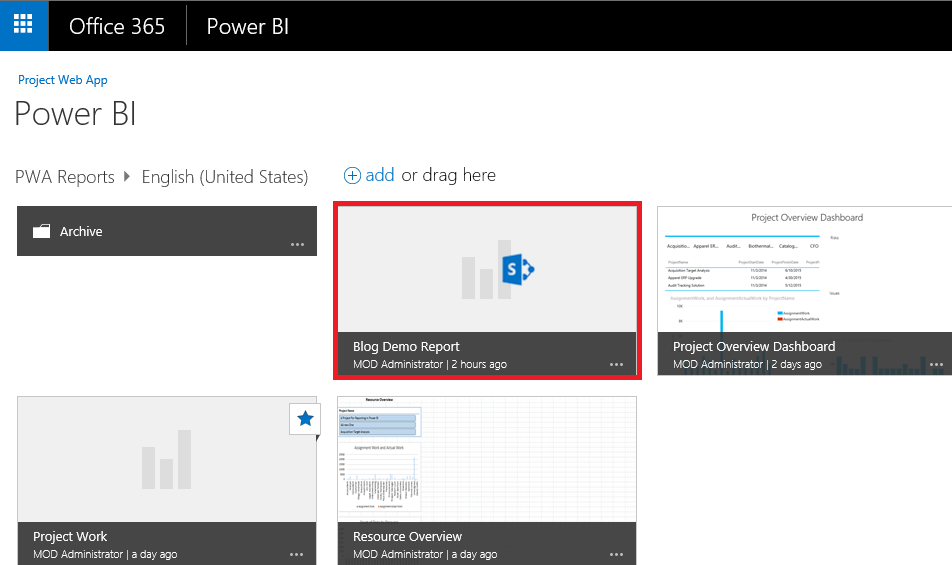
After confirmation, the Enabling process runs, and takes few seconds. After that, you can close the dialog (not Open).
Now, the report has wysiwyg aspect.
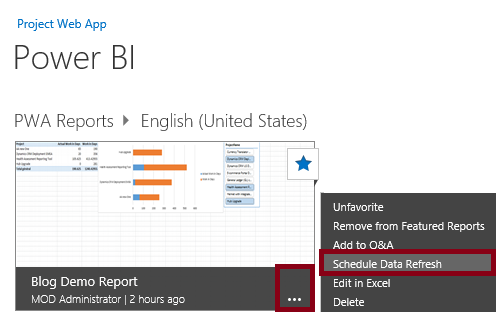
Now we will schedule the Auto Refresh. For that, click again on the Ellipsis, and select Schedule Data Refresh. Previously, you can add the report to the Features report, and to the Favorite: it will make your life easier when you will access to the report later.
The next page will let you setup the Auto Update process.
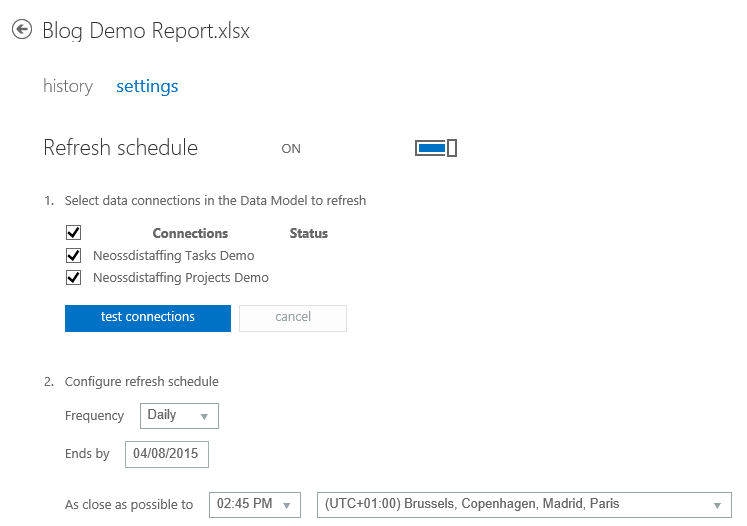
You must test the connections before moving forward. This test process will raise an error for all the connections. I have no explanation why, seem to be a language problem: I was not able to find a solution: I will update this post as soon I will get a solution.
Nevertheless, even after this error, we can save the settings, and the update will work.
Clic on Save and Refresh Report, or Save settings, and the update will be queued.
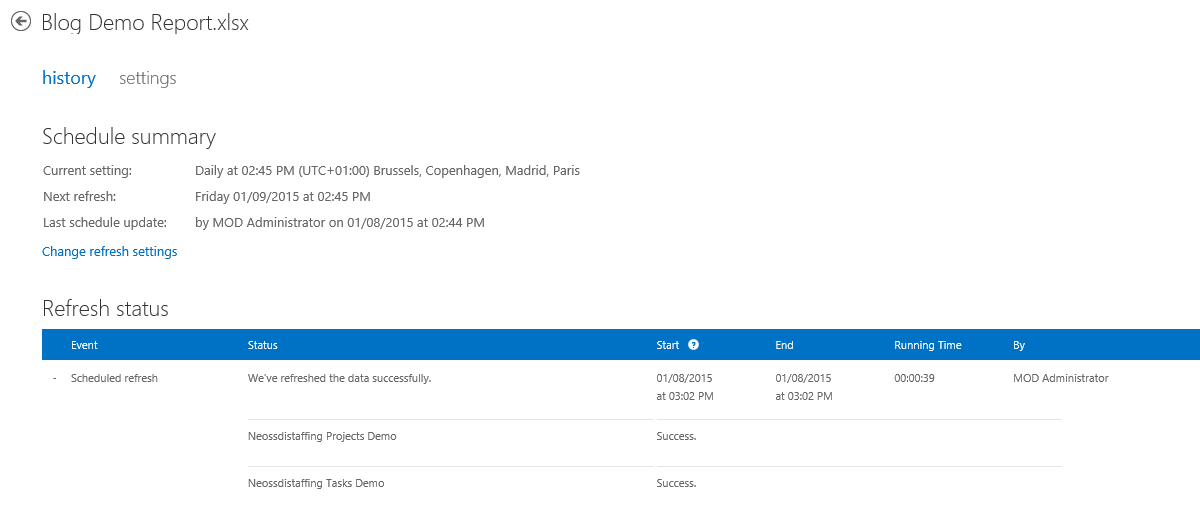
If you clickk on History, you will see the Update process. Depending on the schedule time, the document will be updated.
Be sure that your Excel document is not opened somewhere when the Refresh is scheduled, otherwize Power BI will not be able to check out, modify and Save the Excel document. If the Refresh Process fails, it will be automatically retried.
When the Update is successfull, the status will be marked as We’ve refreshed the data successfully.
Licensing info This part is an update of the initial post: what about licences ?
The global licencing rules are described in a FAQ at this URL: https://support.office.com/en-sg/article/Power-BI-for-Office-365-FAQ-37a30f7e-75be-442b-b5ef-3c2a0c324b6a#\_pricingandlicensing. Some abstracts:
The following features cannot be accessed by users without a Power BI license:
•Q&A natural language query
•Corporate data catalog access
•Initiate a data refresh
•Access to Power BI Sites
•Data Stewardship
•Mobile and HTML5 access
Under specific cases, some features might be enabled for Sharepoint Online Plan 2 users:
•Access files shared on a Power BI Site (through the standard SharePoint Online document library)
•Consume Power View/Power Pivot workbooks in a browser (files under 10MB)
To sum up: a user without Power BI license will only be able to consume the updated Excel report. The report is located in a SharePoint lib: if the user accesses to this lib, he will "consume" the updated data. If we want to allow him additional functionality like Q&A, he must have a subscription.
Conclusion
Project Online is a very interesting solution for Project and Portfolio Management.
An important limitation was the reporting, because of the unavailability of SQL Server database.
Different answers can be proposed, with one of the most used software: Excel.
Depending of the level of automaticity each company wants, complete the subscribtion with at least one Power BI licence for the administrator is a very efficient option.
