Remote Debugging - Visual Studio 2010
**Introduction: **
We have been facing hurdles several times due to unavailability of environment where the software product is deployed. Sometimes, it becomes so much time consuming to find out the issue in our software product due to environment availability and thus we try to find out the issue by implementing regressive logging, capturing these logs and finding out the exact issue. This logging sometimes has to be repeated till we find out the exact root cause.
This article is for the developers and testers who have never used the Remote Debugging feature of Visual Studio. Through this article I will guide you how to debug from the code in your local machine in case you don't have the running product environment in your local system.
Suppose your product is deployed in a server The product may contains multiples modules and binaries as a part of it. Now suppose a user has reported an issue the is related to a Binary/Module. To find out the issue by code debugging, the Visual Studio has provided a great feature which is "Remote Debugging". Through remote debugging you will be able to generate the scenario from server end by using the product and debugging it through the local system where the code is.
Remote Debugging Monitor (msvsmon.exe) :
The Remote Debugging Monitor is a small application that allows you to debug the software component remotely. Before using the Remote Debugging Monitor, you must setup it in your server where the application is. Below are the steps to setup the Remote Debugging Monitor.
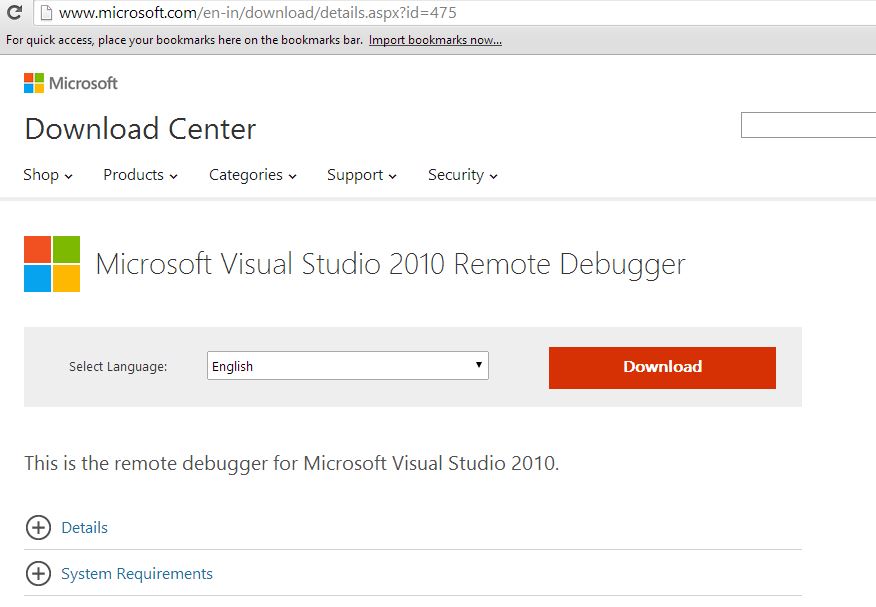
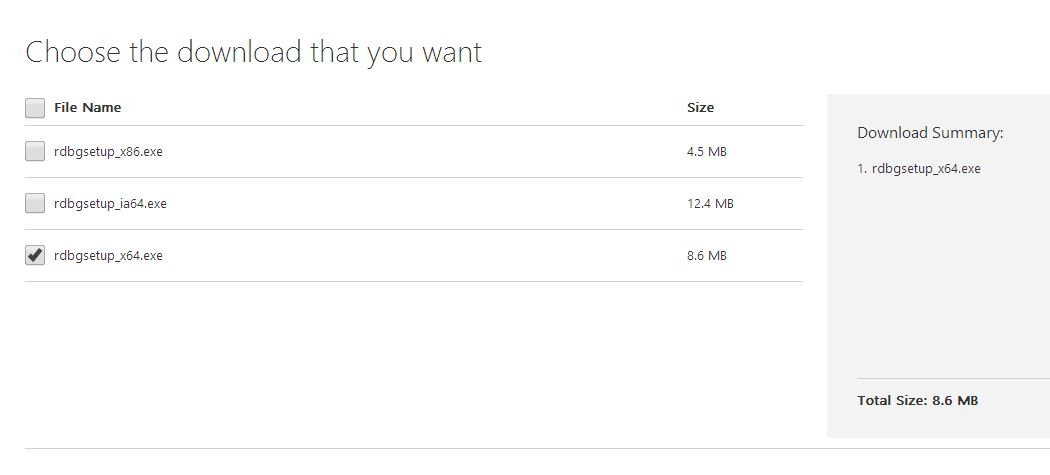
- Download the Visual Studio 2010 Remote Debugging Monitor. Make sure to select the correct version according to the server configuration (32 bit or 64 bit).
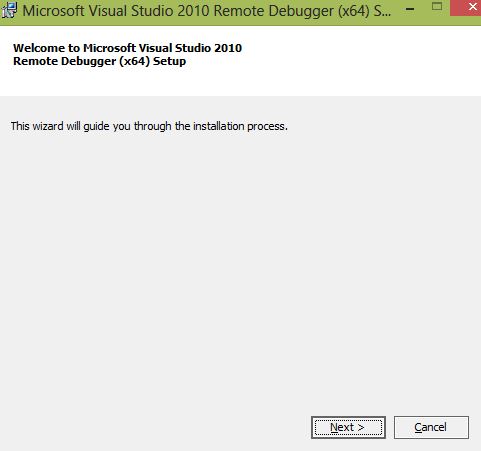
- Install Remote Debugging Monitor.
Go to the below mentioned path and execute msvsmon.exe.
For 64 bit Server : "C:\Program Files (x86)\Microsoft Visual Studio 10.0\Common7\IDE\Remote Debugger\x64"
For 32 bit Server : "C:\Program Files (x86)\Microsoft Visual Studio 10.0\Common7\IDE\Remote Debugger\x32"Start the Remote Debugging Monitor.
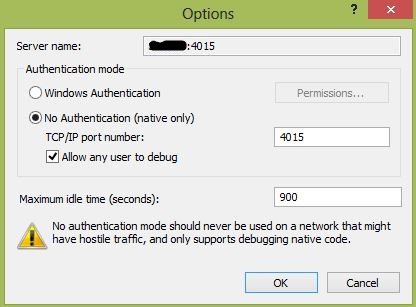
- GoTo the options menu and configure it as below.
- Now the Remote Debugging Monitor is running with access to all users.
**Debugging the application remotely **
To debug any application or component of any application, follow the below steps mentioned:
- Copy the dll/exe and the pdb file from the debug folder of the CodeBase where the binaries are compiled.
- Paste these dlls/exes and the pdb file to the application deployment folder on the server.
- Now in case of Windows/Console application do the below steps:
- Run the application on the server.
- On the local machine, Open code in Visual Studio.
- GoTo Debug from Menubar and select "Attach to Process..".
- Enter remote IP or server name in the Qualifier text box and hit Enter.
- Look for the process of your application from the list and click OK.
- In case of Web application, follow the below steps:
- Open the application through browser.
- On the local machine, Open code in Visual Studio.
- GoTo Debug from Menubar and select "Attach to Process..".
- Enter remote IP or server name in the Qualifier text box and hit Enter.
- Select "w3wp.exe" and click Ok.
- Set the appropriate breakpoints in the code.
- Process the application and generate the scenario.
- The application remotely will hit the breakpoint due to Remote Debugging Monitor.
**Points to ponder **
There are other options as well which we can configure to restrict anonymous users to allow debugging through the tool. In some case, other elements like Firewall can restrict the remote debugging in-spite of the Remote Debugger Monitor service running. So, such concerns we have to take case in case of any issue.


