SharePoint 2010: How to Create a Stacked Bar Chart with Column Totals
Introduction
This article shows you how to create a stacked bar chart in page in SharePoint Server 2010, step-by-step. It uses both SharePoint Designer 2010 and the web front end tools to build and configure the chart. This article assumes that you already have a list to which you want to connect the chart.
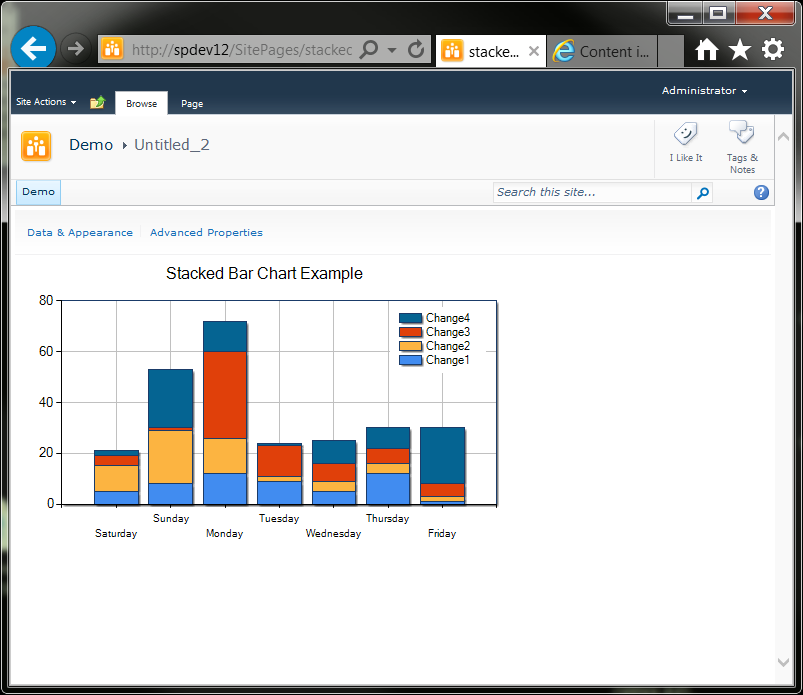
It starts by walking you through how to connect a chart to a SharePoint list. It then walks you through how to add multiple series (list columns) to the chart and then configure these series as a stacked bar chart. You'll learn how to enhance the chart in a few key ways, such as hiding the chart toolbar, and then you'll learn how to add sums that appear at the top of each stacked bars using a little trick.
Add a new Web Part Page
- Launch SharePoint Designer 2010.
- Connect to the target site.
- Navigate to the Site Pages folder.
- Add a new Web Part Page.
- Save and close the page.
- Exit Designer.
Add the Chart Web Part
- In any browser, navigate to the target page you created.
- On the Page ribbon, click Edit Page.
- On the page body, click Add a Web Part.
- On the Categories panel, select Business Data, and then select Chart Web Part.
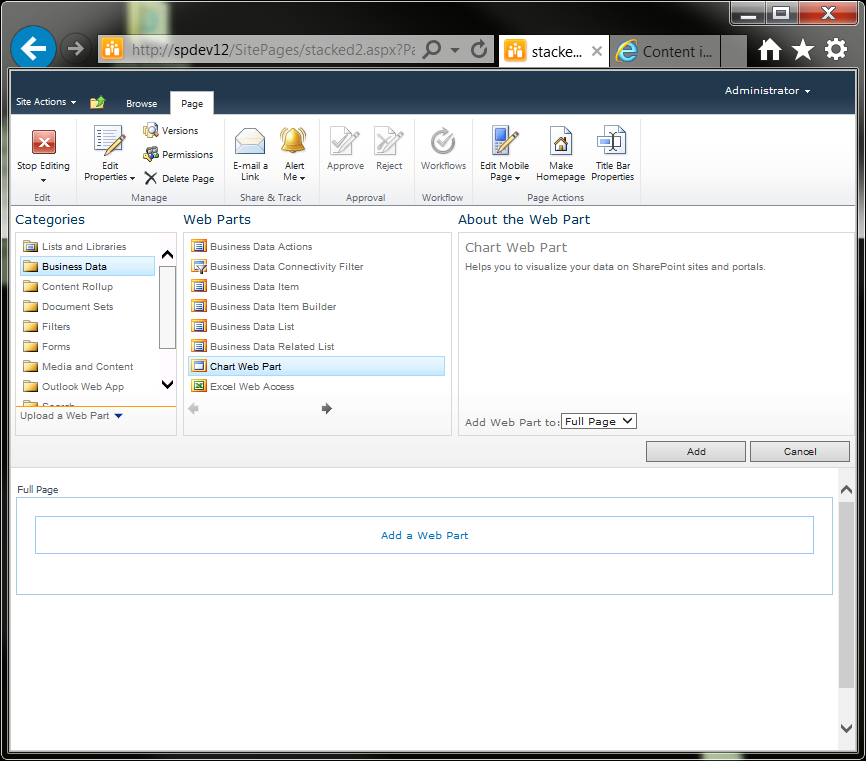
- Click Add.
- On the Page ribbon, click Stop Editing.
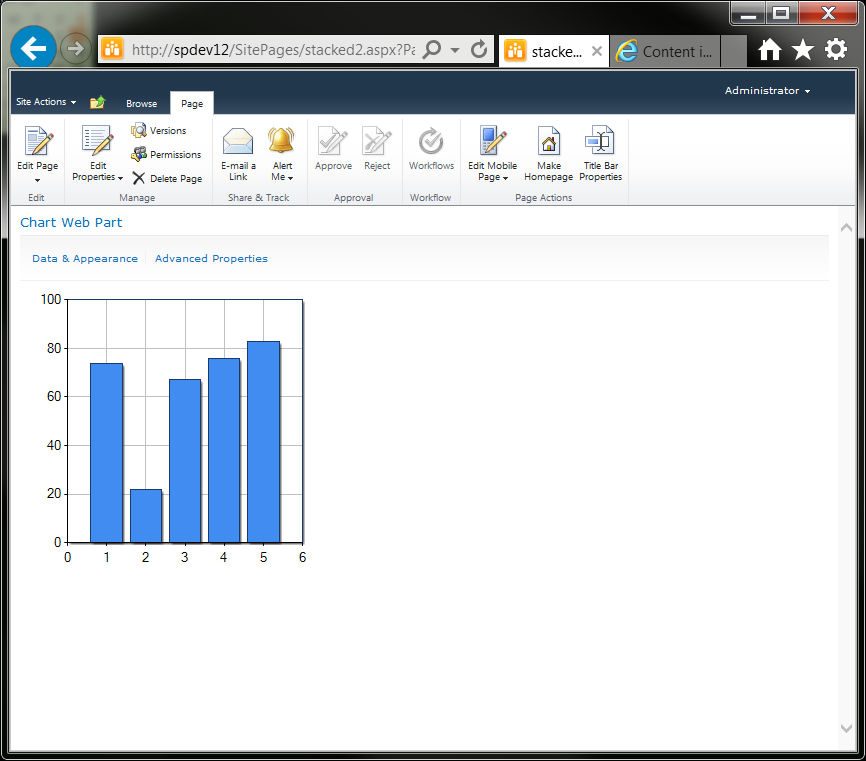
Connect the Chart Web Part to Data
- On the Chart Web Part, click Data & Appearance.
- Click Connect Chart to Data.
- Select Connect to a list, and then click Next.
- From the List dropdown, select the target list.
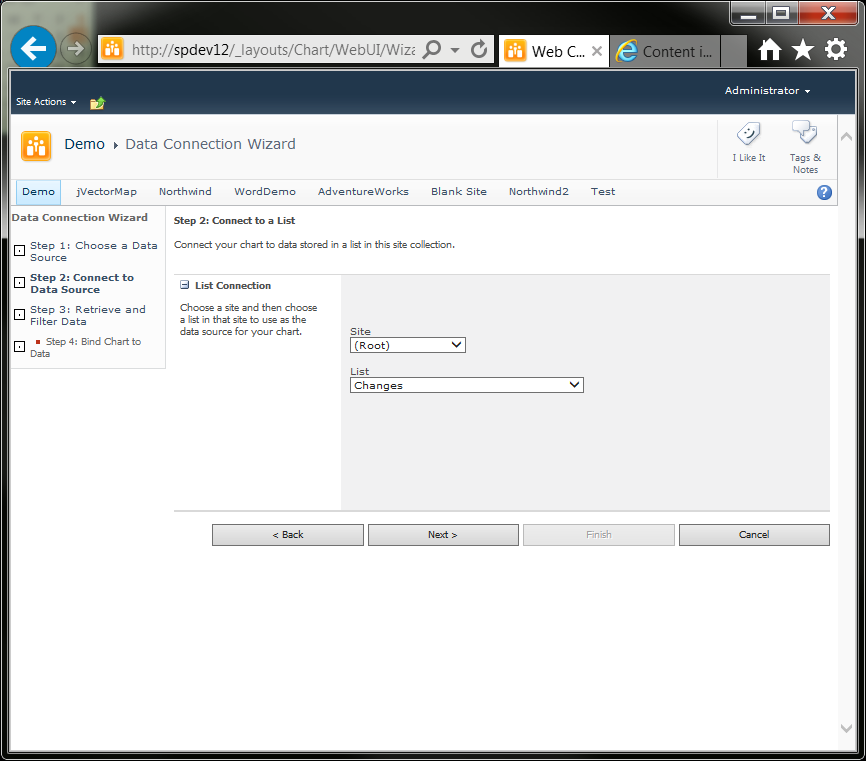
- Click Next.
- Leave all defaults, and then click Next.
- Click Finish. You'll come back to this in the next section.
Connect and Configure Data Series
- On the Chart Web Part, click Data & Appearance.
- Click Connect Chart to Data.
- Click Series Properties.
- In the Series Name field, change the name from Default to Change1 (or your first series name).
- From the Series Type dropdown, select Stacked Column.
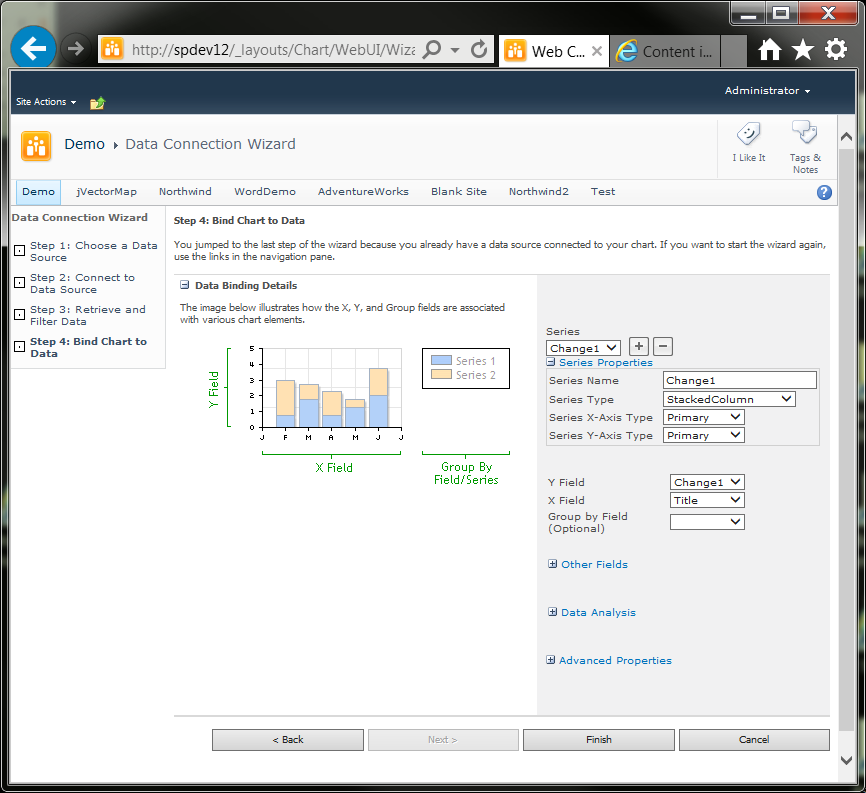
- Click the + button next to the Series dropdown. This adds a new data series (the second).
- In the Series Name field, change the name from Series 2 to Change2 (or your second series name).
- From the Series Type dropdown, select Stacked Column.
- From the Y Field dropdown, select Change2 (or the column name of your second series).
- Click the + button next to the Series dropdown. This adds a new data series (the third).
- In the Series Name field, change the name from Series 3 to Change3 (or your third series name).
- From the Series Type dropdown, select Stacked Column.
- From the Y Field dropdown, select Change3 (or the column name of your third series).
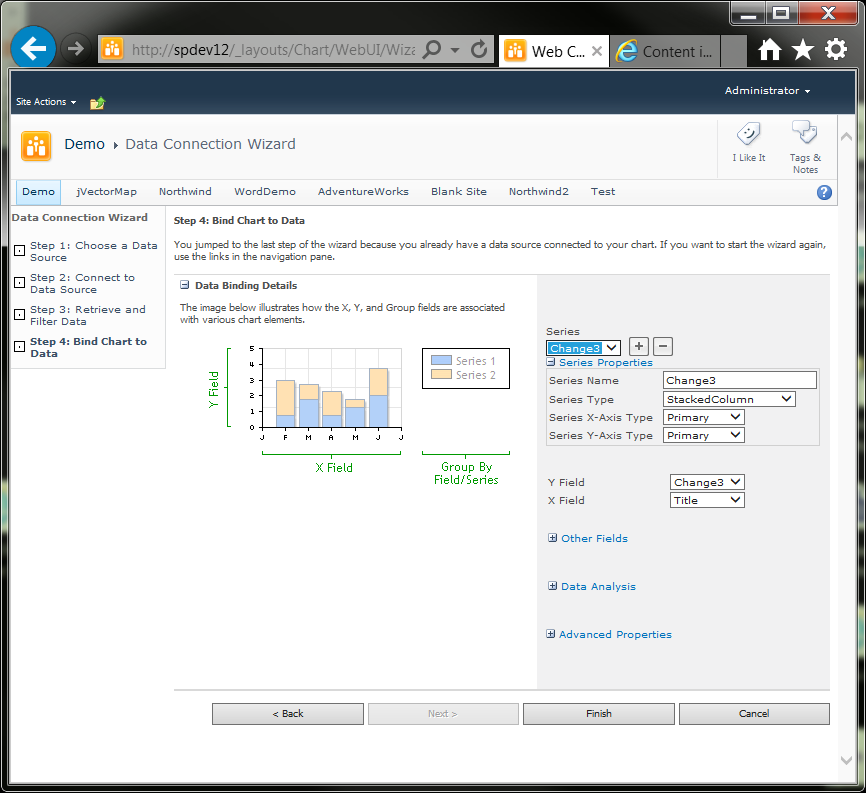
- Repeat as necessary for each series. Series correspond to columns in the source list.
- Click Finish.
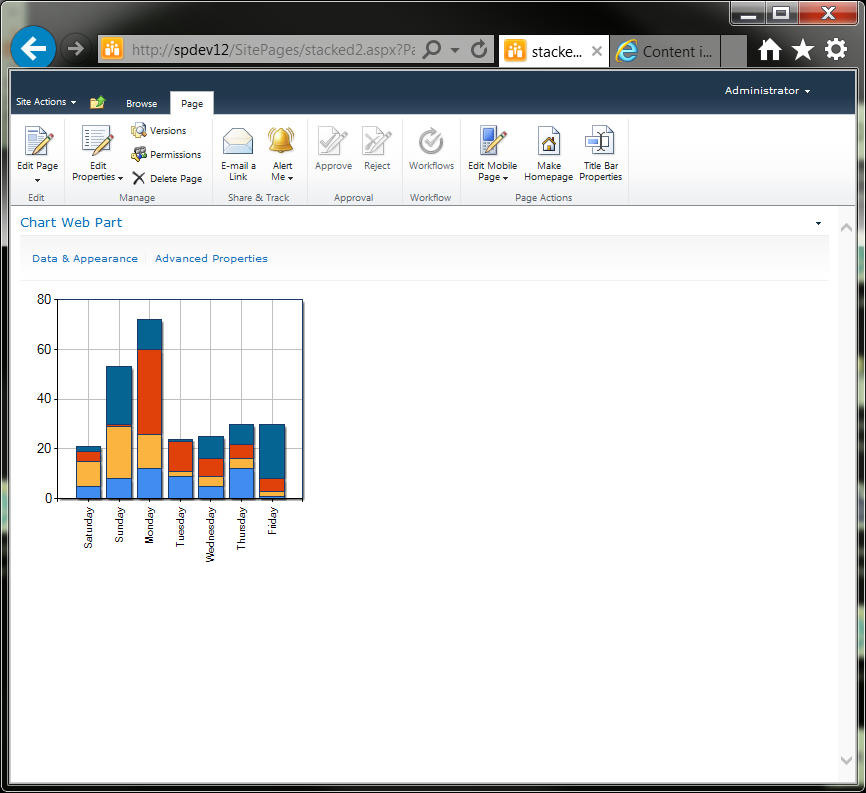
Configure Appearance
- Hover the cursor over the Chart Web Part title to expose the title bar dropdown.
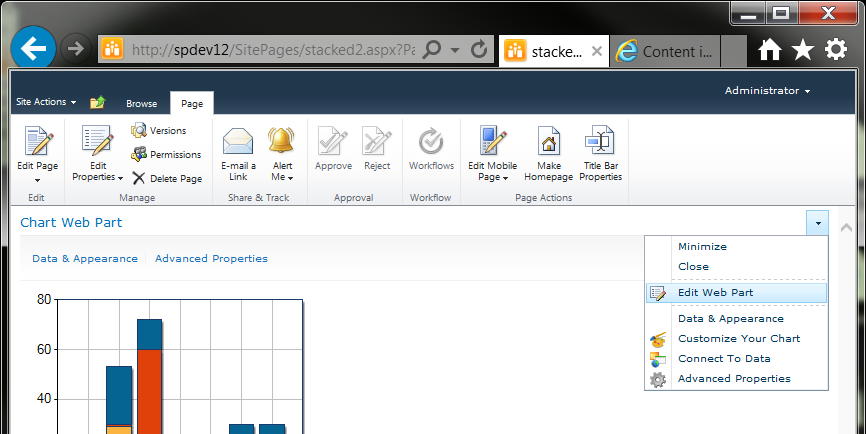
- Select Edit Web Part.
- Scroll to the bottom to the Appearance section, and then from the Chrome Type dropdown, select None.
- Click OK.
- On the Chart Web Part, click Advanced Properties.
- On the Chart Properties panel, scroll down to the Layout section, change the Width property to 500px, and then press Enter.
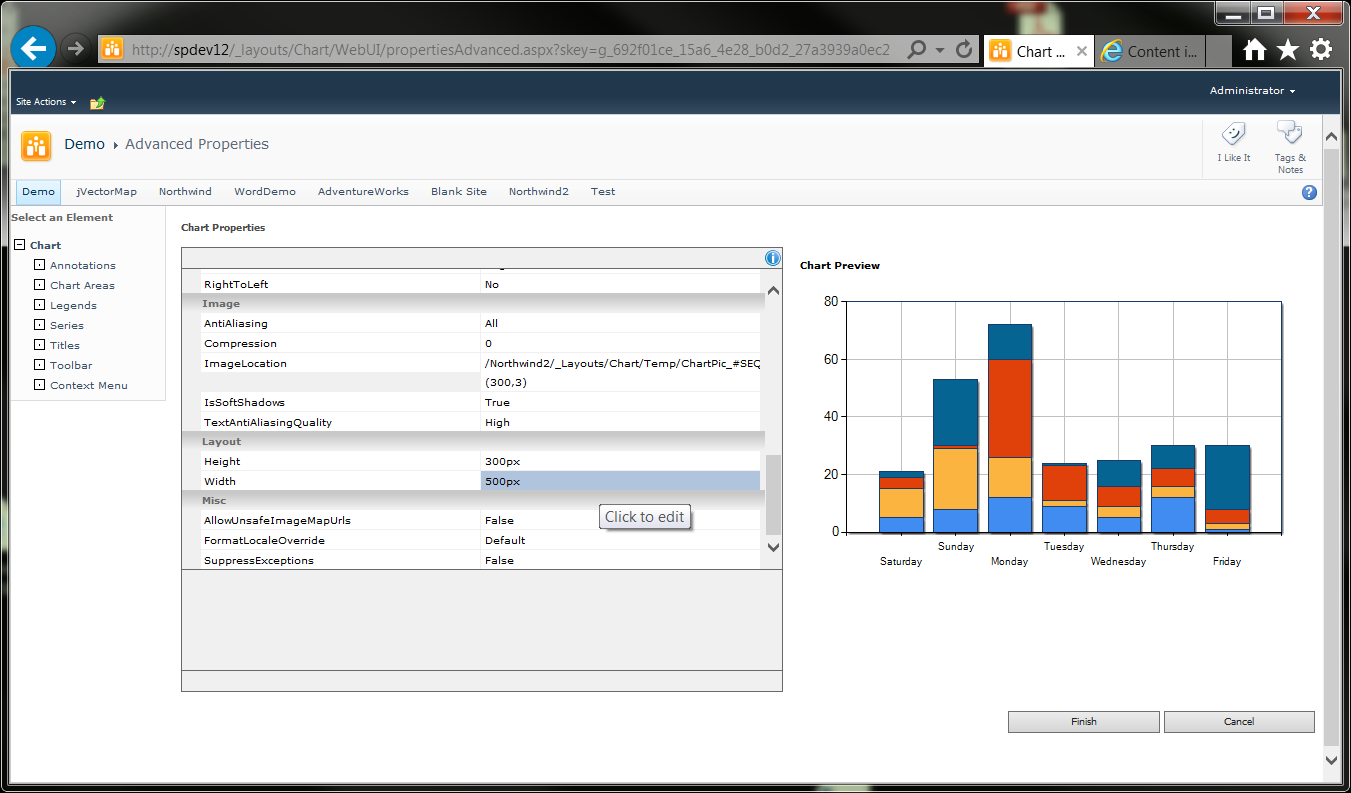
- On the Select an Element panel, click Legends.
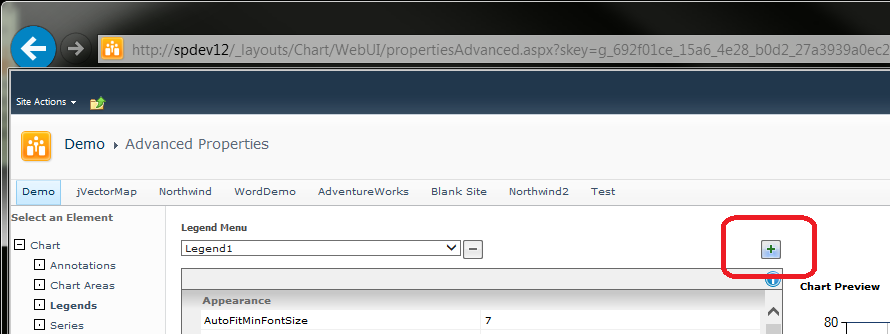
- Click the + button to the right of the Legend Menu dropdown.
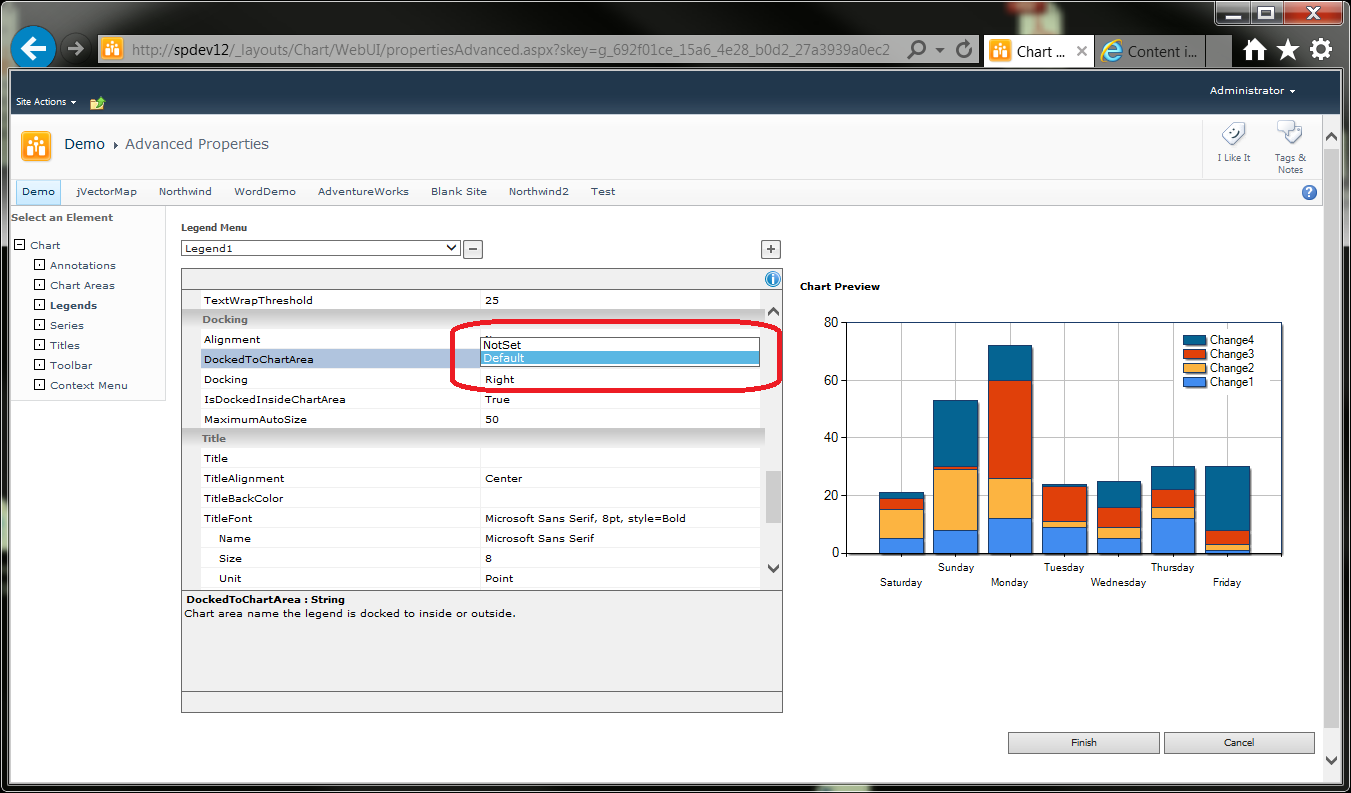
- On the Chart Properties panel, scroll down to the Docking section, and then from the DockedToChartArea dropdown, select Default.
- On the Select an Element panel, click Titles.
- Click the + button to the right of the Titles Menu dropdown.
- On the Chart Properties panel, scroll down to the Text property, and then enter a title.
- Scroll up a bit to the Size property, enter a larger font size, and then press ENTER.
- From the Bold property dropdown, select True.
- Click Finish.
Hide Chart Web Part Toolbar
- Launch SharePoint Designer 2010.
- Checkout the target page.
- Open the page in Code view (no need to go into Advanced Mode).
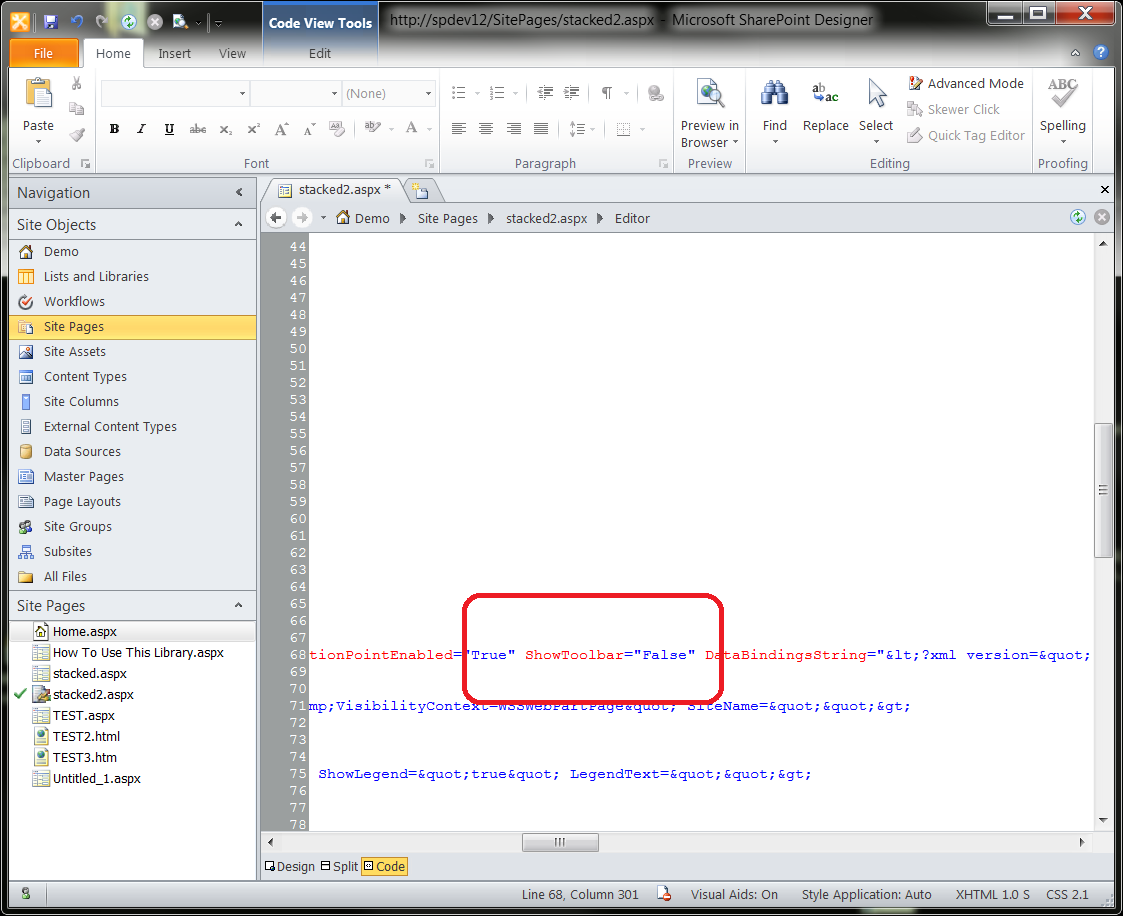
- Search for ShowToolbar.
- Save and close the page.
- Check the file back in.
- Exit Designer.
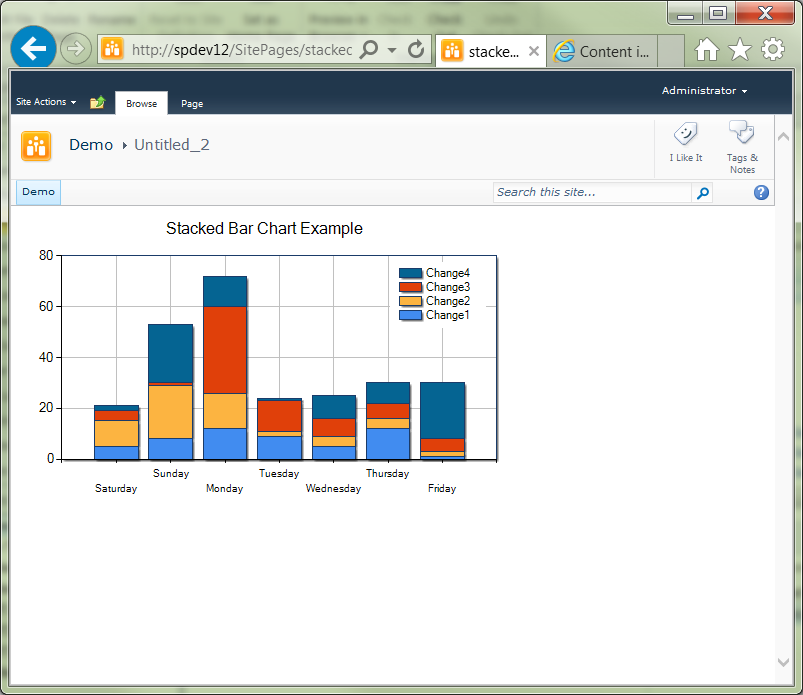
Add Data Enhancements
- Open a browser and navigate to the target page.
- On the Page ribbon, click Edit Page.
- From the Chart Web Part title bar dropdown, point to Advanced Properties.
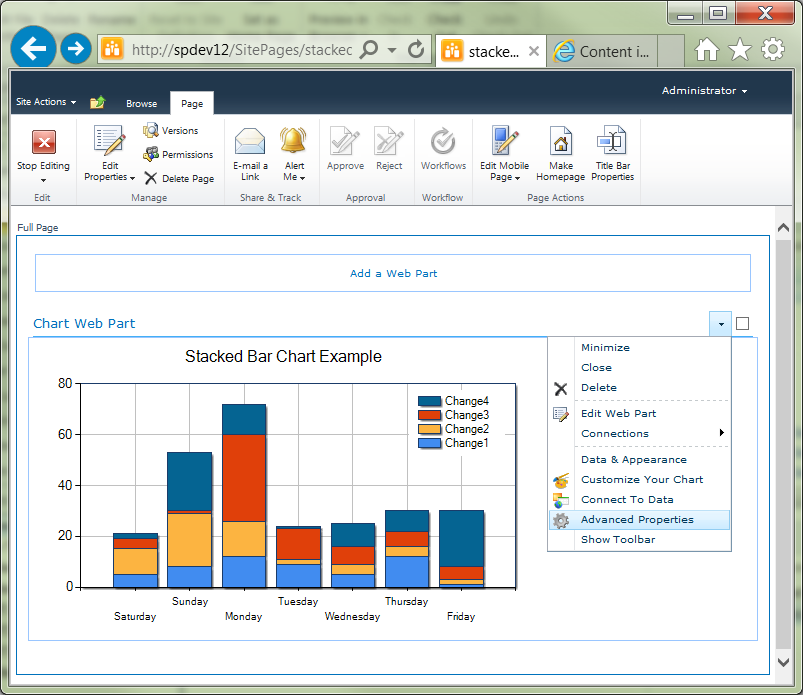
- Click Advanced Properties.
- On the Select an Element panel, click Series.
- On the Chart Properties panel, scroll down to the MapArea section, and then in the ToolTip field, enter #VAL, and then press ENTER.
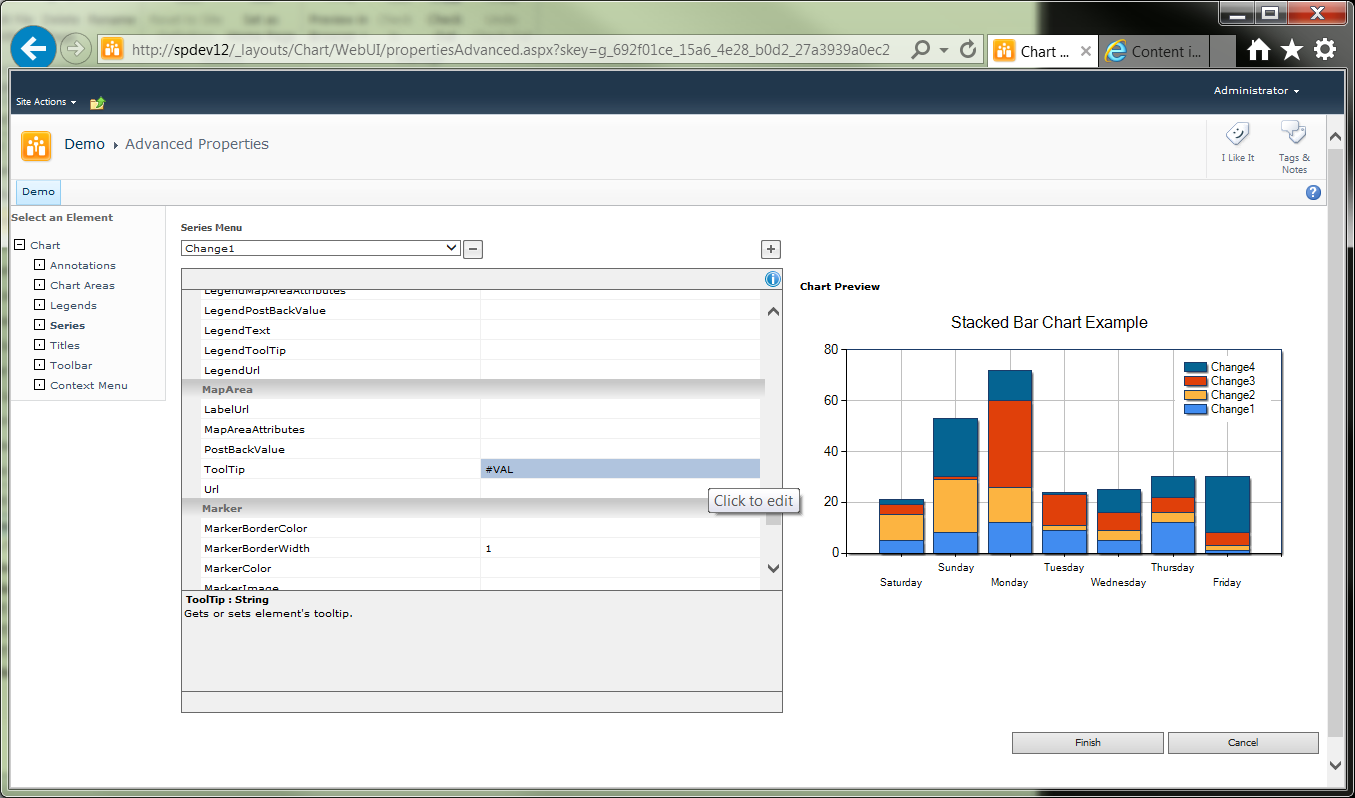
- Hover the cursor over the Change1 bars (bottom in this figure) to verify that popup numbers appear.
- From the Series Menu, select Change2 and repeat for each series.
- Click Finish.
- Hover the cursor over any stacked bar to verify value.
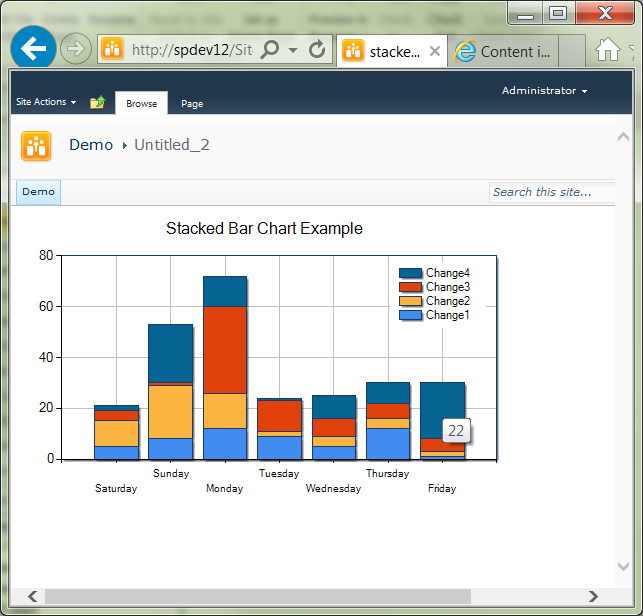
Add Column Totals
- Add a calculated column to the source list. For this procedure, we'll call it StackedTotal. Set the column value to the sum of the other columns.
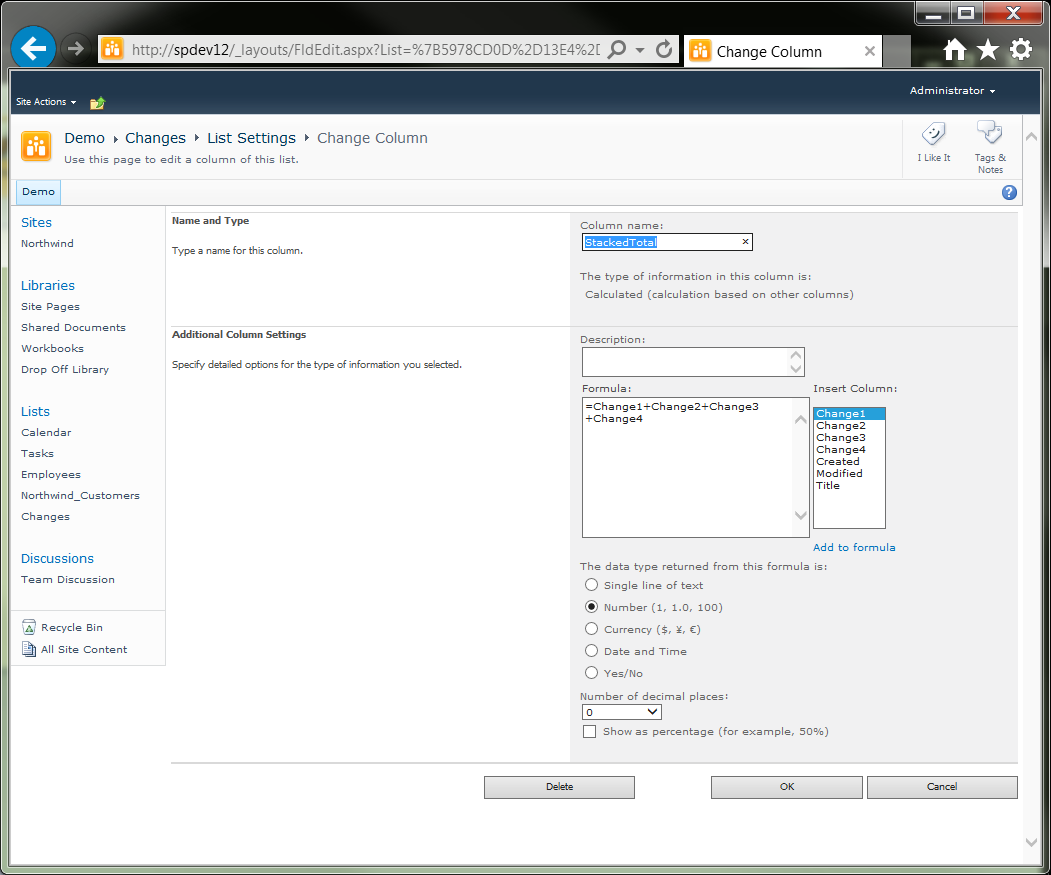
- Open a browser and navigate to the target page.
- On the Page ribbon, click Edit Page.
- From the Chart Web Part title bar dropdown, click Data & Appearance.
- Click Connect Chart to Data.
- Click Series Properties.
- Click the + button next to the Series dropdown. This adds a new data series (the fifth).
- In the Series Name field, change the name from Series 5 to StackedTotal (or your calculated column name).
- From the Series Type dropdown, select Column (not Stacked Column!).
- From the Y Field dropdown, select the name of the calculated column, in this case StackedTotal.
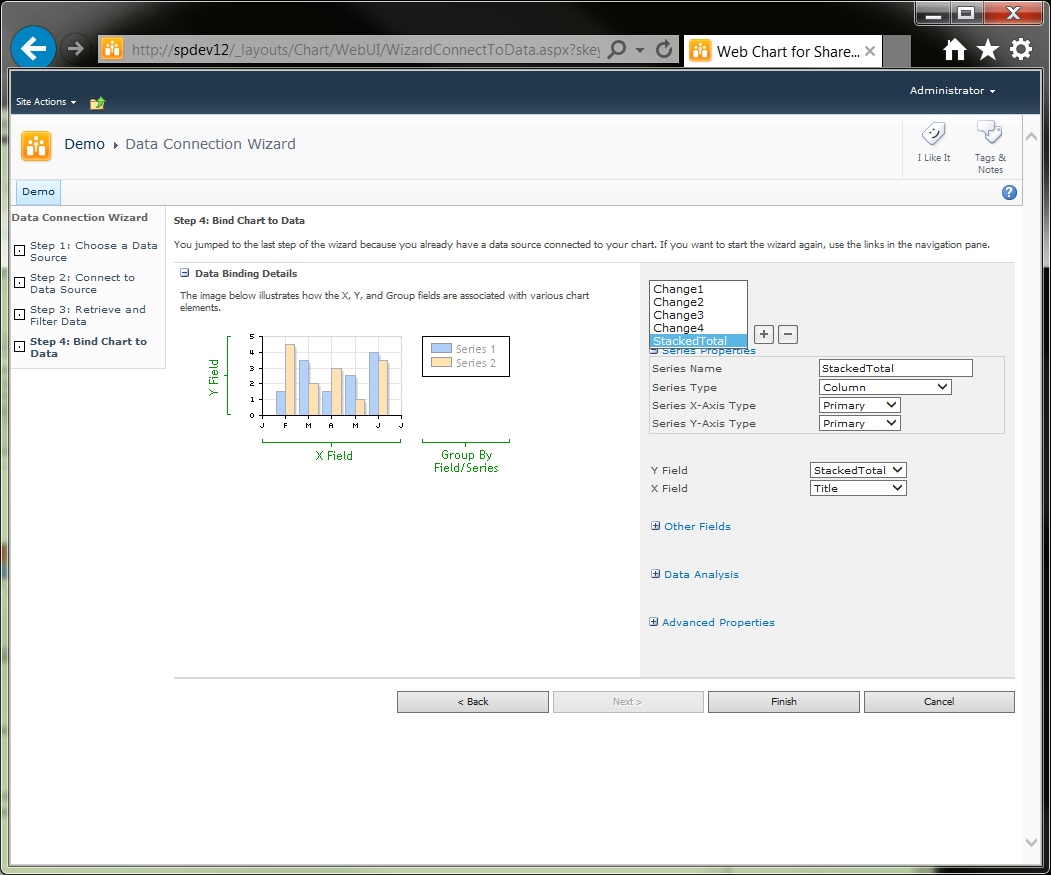
- Click Finish. The original stacked columns are now hidden behind the single new columns.
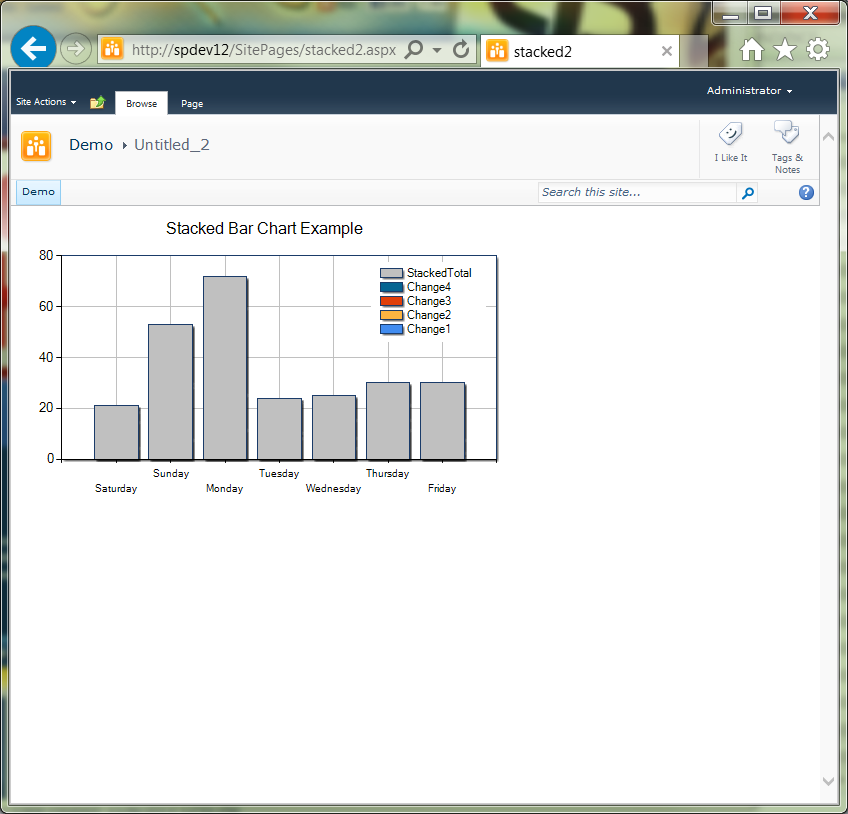
- On the Page ribbon, click Edit Page.
- From the Chart Web Part title bar dropdown, click Advanced Properties
- On the Select an Element panel, click Series
- From the Series Menu, select StackedTotal.
- On the Chart Properties panel, scroll down to the Legend section.
- Change the IsVisibleInLegend property to False. The new column is no longer seen in the Legend.

- Scroll up to the Label section.
- Change the IsValueShownAsLabel property to True. The calculated totals are now displayed as labels above each column.
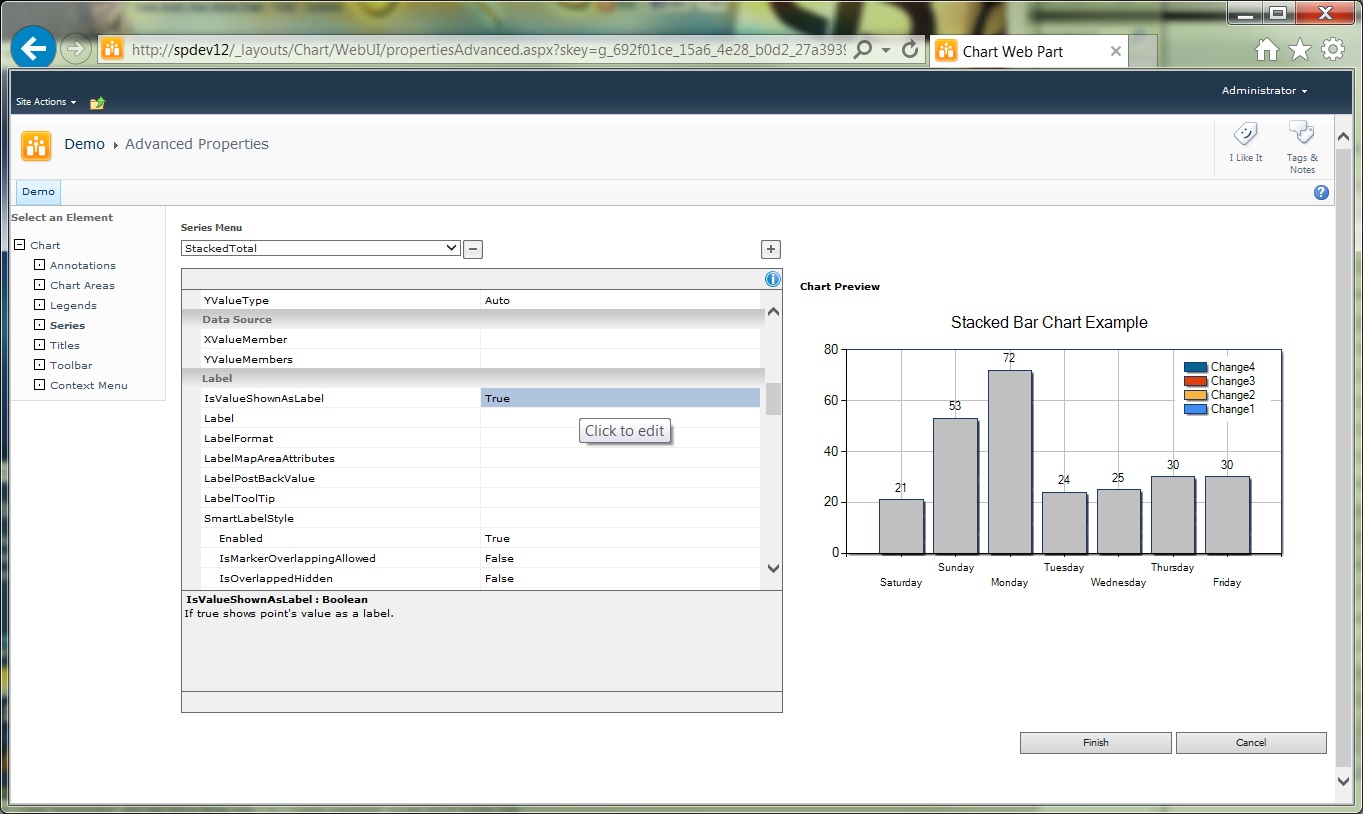
- Scroll up to the Appearance section.
- Open the Color dropdown, and then select Transparent. The new column is no longer visible, but the column labels remain.
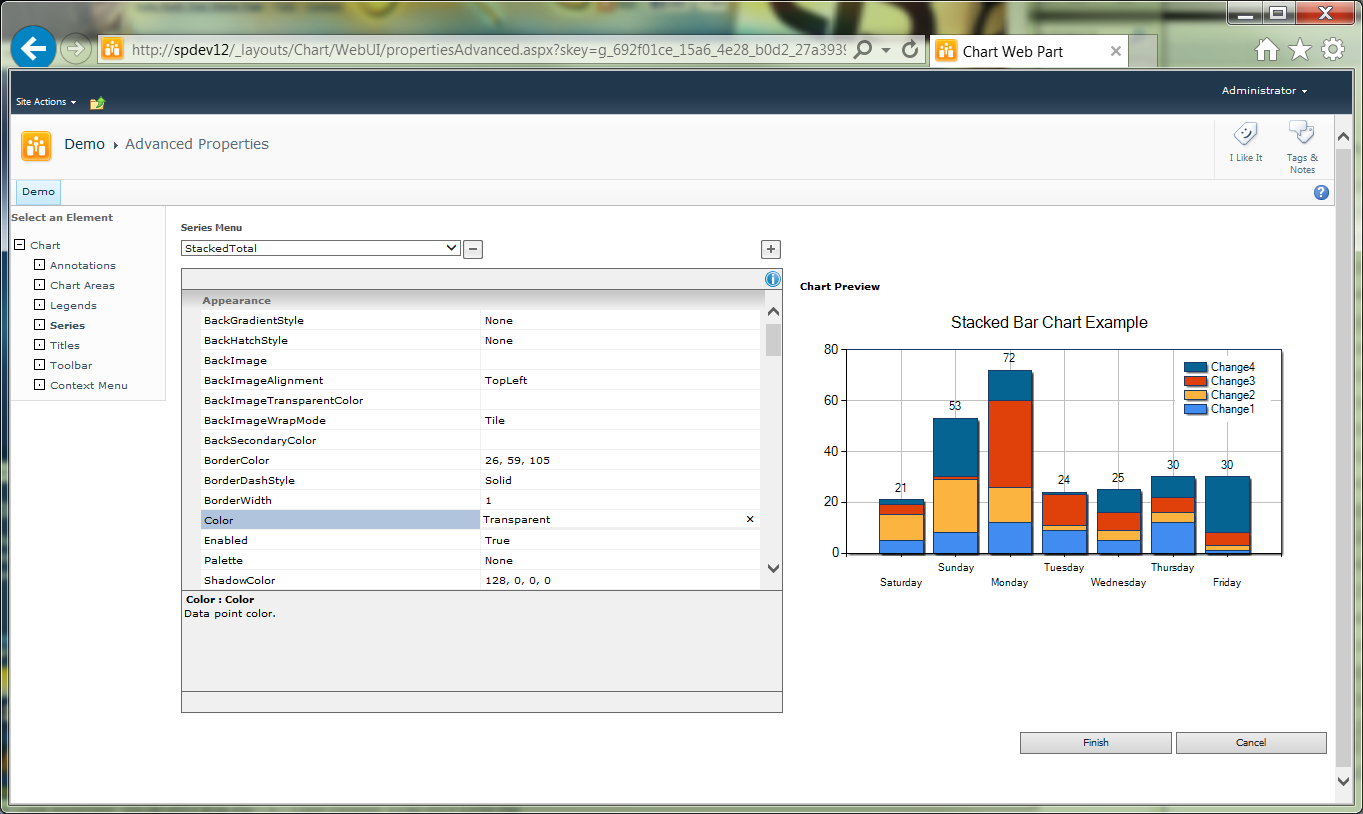
- And the result:
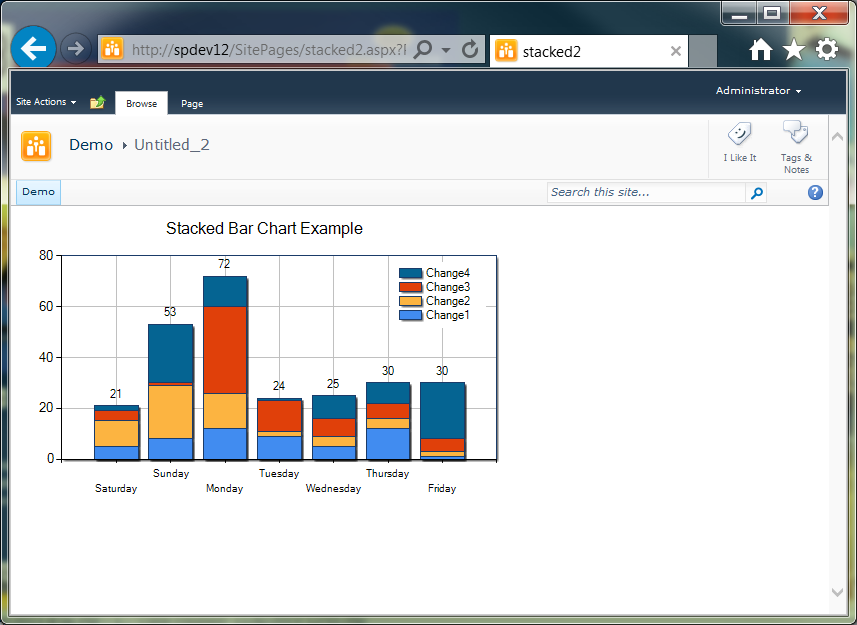
- This concludes this procedure.
Summary
This articled has presented a step-by-step process for creating and configuring a stacked bar chart on a SharePoint Server 2010 page. For additional detail on the topics discussed in this article, see the references.
References
- MSDN: Keywords
- MSDN: Chart Web Server Control Overview
- Creating Complext Charts Using Sharepoint 2010 OOB Capabilities
- SharePoint 2010: no-code drill-down chart
- TechNet: Formatting Data Points on a Chart
Notes
- The key to creating the stacked bar chart is getting the Chart web part to recognize that there are multiple data series; and this is done by creating multiple series during the data connection process.