Debug protractor script in Visual Studio Code
Selenium is a popular open source project to support web end-to-end automation, especially it supports multiple programming languages, such as C#, Java and Python etc. Protractor is based on selenium webdriverjs and provides progamming support from JavaScript approach. Protractor has handy element location support for angularjs, this has made it very popular.
As protractor is based on Node.js and VS Code has built-in debugging support for Node.js runtime, it is easy to develop and debug protractor script in visual studio code. This article will introduce how to debug the script in vs code.
Prerequisite
Suppose you installed Node.js and configured protractor by "npm install protractor --save-dev". For more script development and basic selenium knowledge, please check with https://www.protractortest.org/
Protractor Configuration
The easiest way to begin with protractor configuration is copy node_modules\protractor\example\conf.js to your source repository. Suppose you have it named to protractor.conf.js and support the following two suites:
suites:{
smoke: 'spec/smoketests/*.js', full: 'spec/full/*.js' },
Create launch.json
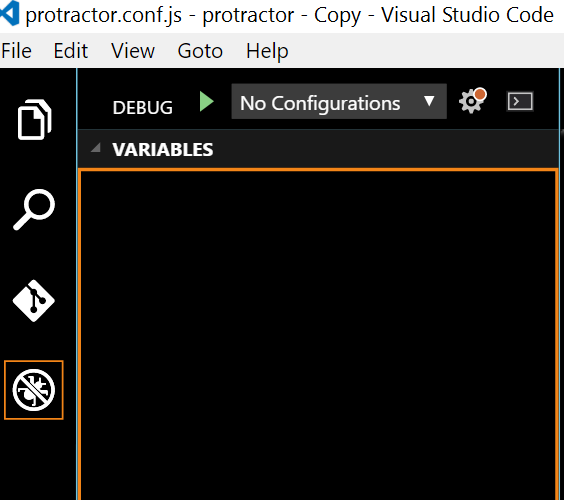
Click on the Debugging icon in the View Bar on the side of VS Code. Click on the Configure gear icon on the Debug view top bar, choose Node.js as the debug environment and VS Code will generate a launch.json file under your workspace's .vscode folder.

Configure protractor in launch.json
Locate the "Launch" entry in launch.json, change program and args in the following
"name": "Launch", "type": "node", "request": "launch", "program": "${workspaceRoot}/node_modules/protractor/bin/protractor", "stopOnEntry": false, "args": ["${workspaceRoot}/protractor.conf.js"],
Debug
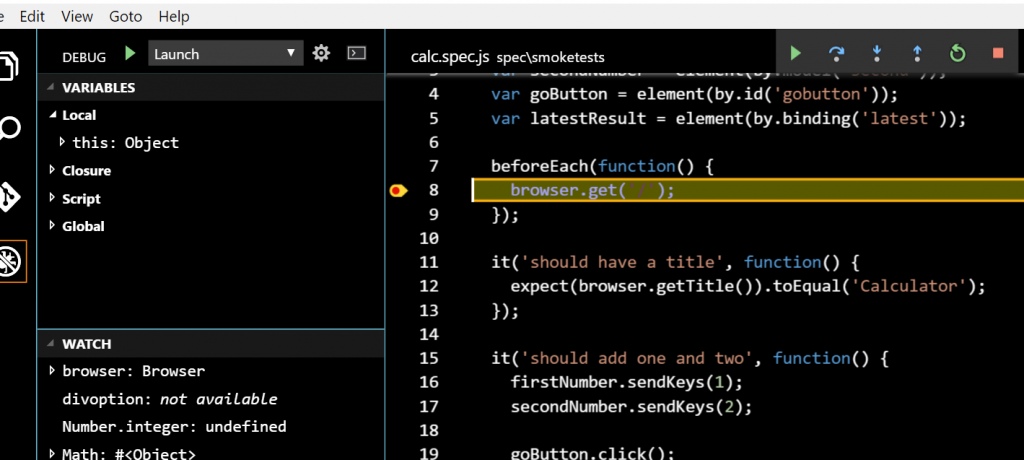
Now, you can click F9 to set breakpoint, F5 to debug the script. Watch and Call stack panels are handy to inspect the running status.

Support Suite in Configuration
Suppose you just want to debug smoke test suite while don't want to change the Launch entry in the launch.json, you can simply copy and paste the Launch entry and rename it to SmokeTest shown below. Furthermore, add "--suite" and "smoke" to the args array entry.
"name": "SmokeTest", "type": "node", "request": "launch", "program": "${workspaceRoot}/node_modules/protractor/bin/protractor", "stopOnEntry": false, "args": ["${workspaceRoot}/protractor.conf.js", "--suite", "smoke"], "cwd": "${workspaceRoot}", "preLaunchTask": null,
Make sure you have chosen SmokeTest in the debug view and it will only run against smoke suite in the next debug session then.
For more information regarding to debug in visual studio code, there is a good introduction in https://code.visualstudio.com/docs/editor/debugging
Comments
- Anonymous
November 11, 2016
Hi Wu Shuai ,I followed all the step you mention above to debug but the problem i am facing is i am not able to see immediate response in the browser , if you can please give me some more information or can you share some sample code to my email id pradeep7856@gmail.com- Anonymous
November 26, 2016
Hi Pradeep,If there is no immediate response in the browser, it doesn't look like an issue in visual studio code itself. Does the test work if running protractor directly from cmd console? Or,probably have a try on other kinds of browser.
- Anonymous
- Anonymous
November 27, 2016
Hi Wu Shuai,Thanks for really good article .I am having similar issue as pradeep. I able to run the test form the command prompt . But when i try to debug the test from VS code, nothing happens in browser.- Anonymous
December 14, 2016
Based on latest Win10 + Node + Visual Studio code, I can reproduce the issue. Looks like the command "node --debug-brk=34433 --nolazy node_modules\protractor\bin\protractor local.conf.js" doesn't work, will check it.Hi kishore, have you used the maxInstances capability shown below? If yes, that could be the problem. capabilities:{ browserName:'chrome', shardTestFiles:true, maxInstances:2 }- Anonymous
December 21, 2016
It doesn't help for me. With parameter shardTestFiles:true chrome doesn't starts, without it it still nothing happens.
- Anonymous
- Anonymous
- Anonymous
December 21, 2016
@Pavel, check the output panel in vs code, if it is hanging similar to “node –debug-brk=34433 –nolazy node_modules\protractor\bin\protractor local.conf.js”, I suppose you can reproduce it by running the command directly in cmd without vs code. Anyway, try the following steps and see whether helps:1, Make sure the local web driver has been updated, you can run "node .\node_modules\protractor\node_modules\webdriver-manager update" to achieve this.2, Check whether there are multiple web driver instances launched, if yes, modify the karma config to limit the number to 1Hope that helps.- Anonymous
December 22, 2016
Resolving of the problem is very simple. Node 6.x needed (was 4.x).
- Anonymous
- Anonymous
January 18, 2017
Thanks Pavel, Node update to v6.9.4 solved it for me (was v5.3 before). - Anonymous
January 18, 2017 - Note that the same problem was present if trying to run protractor in debug mode directly via console (no VS).
- Anonymous
February 21, 2017
i have created angular 2 js project from angular cli and added above launch configuration for my angular. when i try to run e2e tests in angular cli, i am getting error message below and can one of you please help me? node --debug-brk=3299 --nolazy protractor projectpath/protractor.conf.js Debugger listening on [::]:3299TypeError: The specified path does not exist: e2e - Anonymous
May 24, 2017
This blog was a great help when i started protractor on VS code. thank you!- Anonymous
May 25, 2017
Thanks, glad to know it is helpful
- Anonymous
- Anonymous
June 28, 2017
When I launch the debug session, testing are running but breaking points are not hit. What am I missing ? I'm using Angular CLI - Anonymous
August 14, 2018
Protractor version is 3.10.10, I wanted to know, if this debugging works in the above mentioined version.- Anonymous
August 16, 2018
I have not tried in latest vs code and protractor, minor modification might be needed.
- Anonymous
- Anonymous
March 20, 2019
The comment has been removed