Getting Started Microbit & Microsoft’s new https://pxt.microbit.org Environment
Create your first game
We will be using the new Block/JavaScript Development environment https://pxt.microbit.org
When codethemicrobit.com loads you see the following screen
What we need to do is start a new blank programme simply click more new project
We now have a blank project
Step 1: Getting started
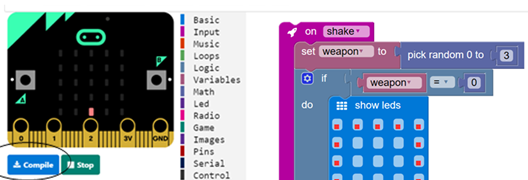
We want the micro:bit to choose rock, paper, or scissors when you shake it. We now need to create the following code – each of the code element are colour coded and correspond to the options available the code block will be in the colour coded option available
We need to use a shake block so when you shake the micro:bit, it will run part of a program.
Next, when you shake the micro:bit, it should pick a random number from 0 to 2 and store it in the variable weapon.
(This variable is named weapon because rock, paper, and scissors are the weapons you use)
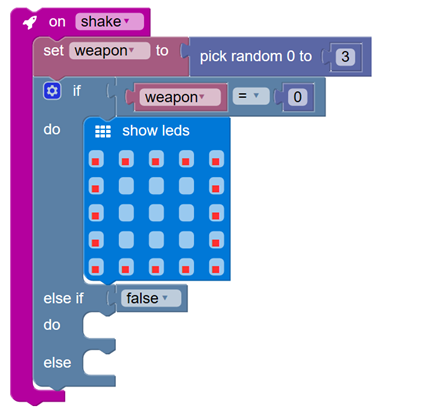
Add a set block with a variable. Then add a pick random block, and store the random number in the variable, like this:
No one can predict random numbers. Each possible number these blocks can make (0, 1, or 2) means a different picture. We will show the right picture for that number on the LED screen.
Step 2: Add Paper
Put an if block after the let block that checks whether weapon is 0. Make sure the if block has an else if part and an else part. Next, add a show leds block that shows a picture of a piece of paper:
Step 3: Add Rock
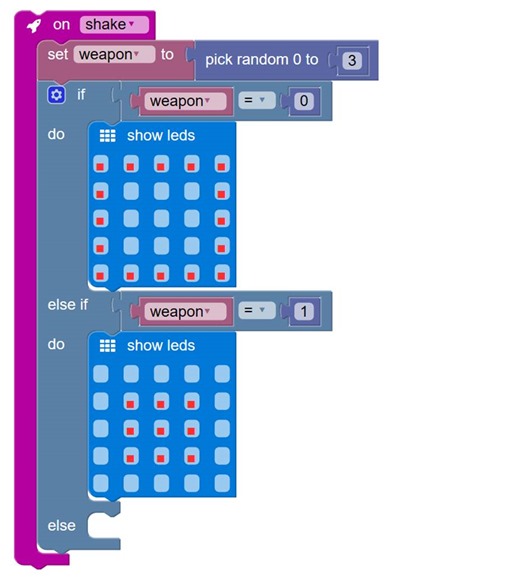
Now we are going to add a new picture for the rock to show when another random number comes up. Make the else if part check if the variable weapon is 1. Then add a show leds block with a picture of a rock.
Step 4: Adding Scissors
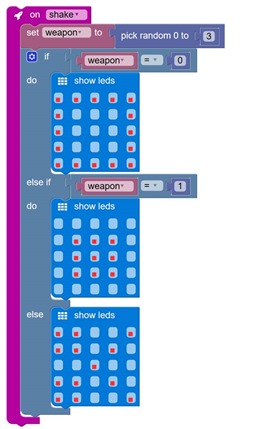
Add a show leds block with a picture of scissors to the else part:
You don’t need to check if weapon is 2 because 2 is the only number left out of 0, 1, and 2. That’s why you can use an else instead of an else if.
Your game is ready! Have fun!
Step 5: Are you the greatest?
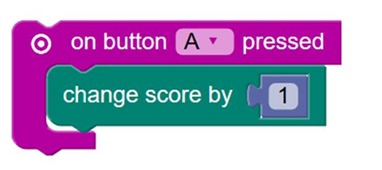
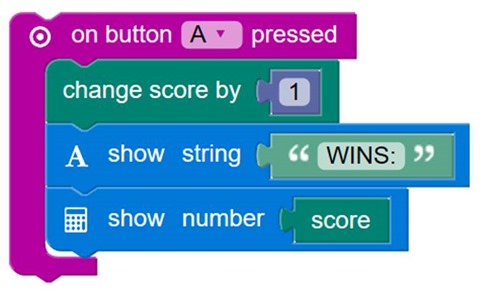
Here is a way you can make your Rock Paper Scissors game better. When button A is pressed, the micro:bit will add 1 to your score.
Open the Game drawer, and then add the block change score by 1 to your program, like this:
Step 6: Prove you’re the greatest!
After your micro:bit can add 1 to the score, show how many wins you have.
Step 7: Compiling the application and copying it your Microbit
In this step we will compile the application we have just created onto the microbit. Simply connect your Micro:bit via the USB cable and press compile
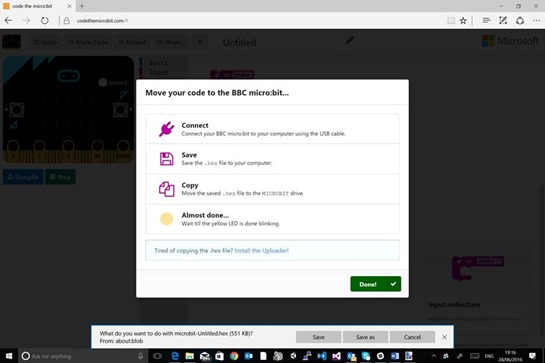
Simply follow the instructions
Building your own seismograph which stream data from the Micro:bit to Azure visualising in Excel
Prerequisites
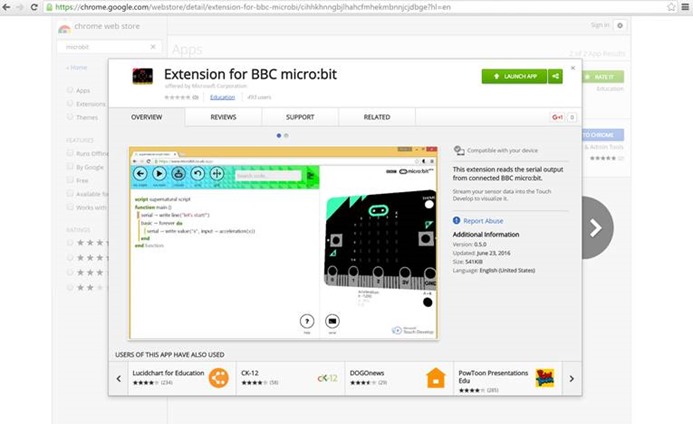
To be able to complete this tutorial you will need to have Chrome installed and have added the Chrome Extension for BBC Micro:bit which is available free of charge from the Chrome store. Open the following link in Chrome https://chrome.google.com/webstore/detail/extension-for-bbc-microbi/cihhkhnngbjlhahcfmhekmbnnjcjdbge?hl=en
Install the microbit serial driver
https://developer.mbed.org/handbook/Windows-serial-configuration
You will need Microsoft Office 2016
You will also need 2 Micro:bit devices.
We will be using https://pxt.microbit.org and programming using Microsoft Block
Step 1 – Reading a sensor
For the first step we want to read the accelerometer sensor on the BBC Microbit
In this project we are going to plot the accelerometer “strength” value into a bar chart in Excel.
Go to https://pxt.microbit.org and create a new project
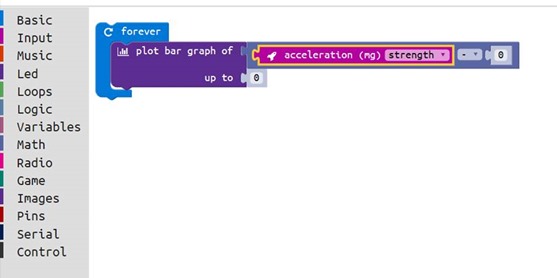
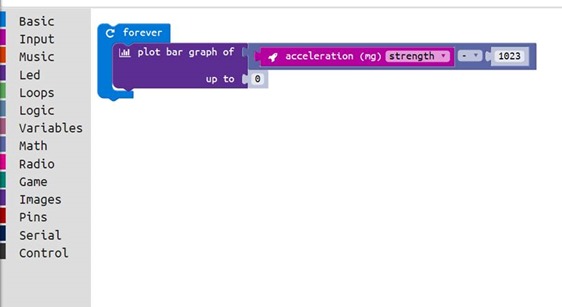
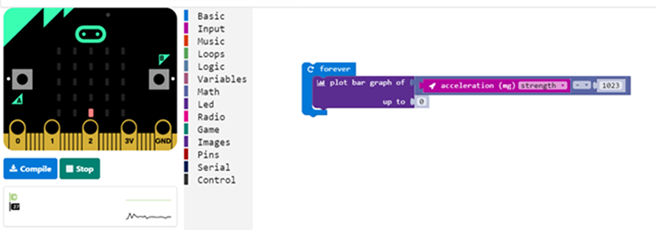
We now need to create the following code – each of the code element are colour coded and correspond to the options available the code block will be in the colour coded option available
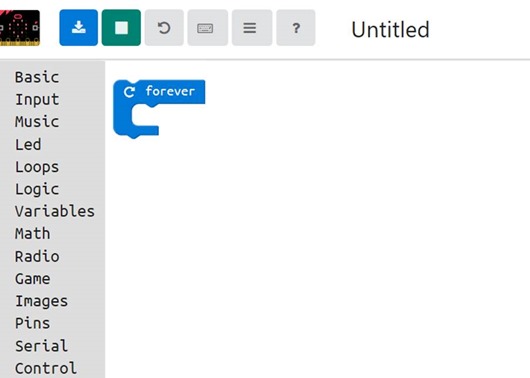
To do this we first select basic -> then select the forever loop
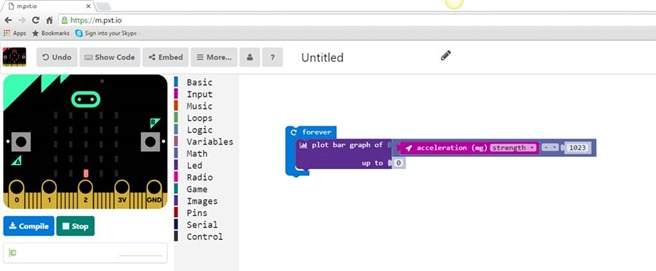
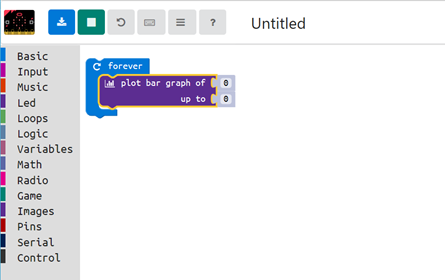
We then need to select plot bar graph from the LED Group
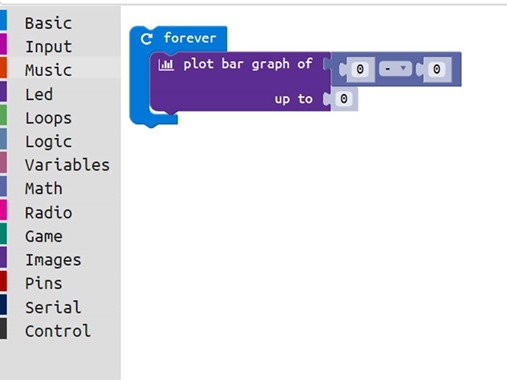
Next we select Math then the minus
The we select input – acceleration (mg) and change the x to strength
Now I need to add 1023 to the value
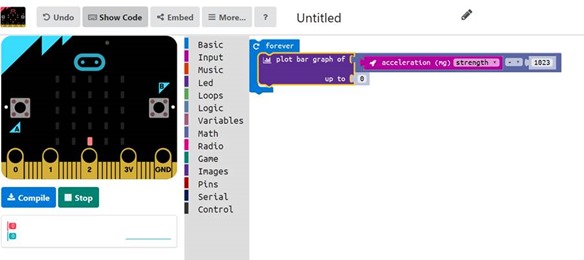
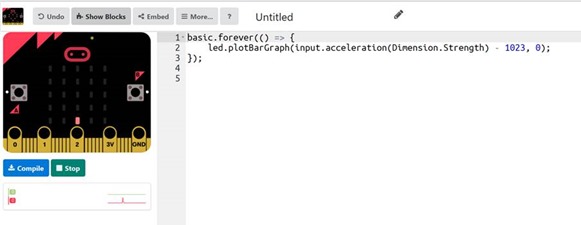
If you want to see the JavaScript code for this script, by simply selecting show code
This converts the block code to JavaScript
Note: If you removed 1023 from the value. When the Micro:bit is sat still it reads a strength of 1024 from the accelerometer. Removing this value means that when it’s under normal gravity the graph will plot it’s smallest value 1 – then when a negative or positive increase is detected this can be read as an increase or decrease in mG
This is Step 1 complete and you now understand how to construct code blocks to develop your first Micro:bit project and convert block to javascript.
Step 2 – Compile
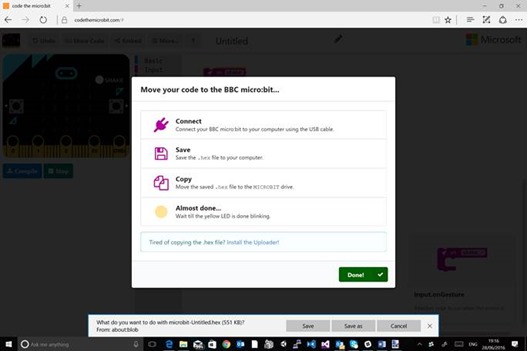
In this step we will compile the application we have just created onto the microbit. Simply connect your Micro:bit via the USB cable and press compile
Because were running the application in chrome with the Micro:bit Chrome extension we can see live data being streamed of the Micro:bit over the USB Cable. The live reading is below the Compile button on the www.codethemicrobit.com
Simply follow the instructions
At this point you can tap or shake your Micro:bit about and you will see the live data change, you are now also ready to stream this data to Azure.
Step 3 – Making a remote sensor
So in Step 1 and Step 2 we built a simply application and deployed it to our Micro:bit with the use of the Micro:bit Chrome extension we can see the data readings being visualised as you moved the microbit.
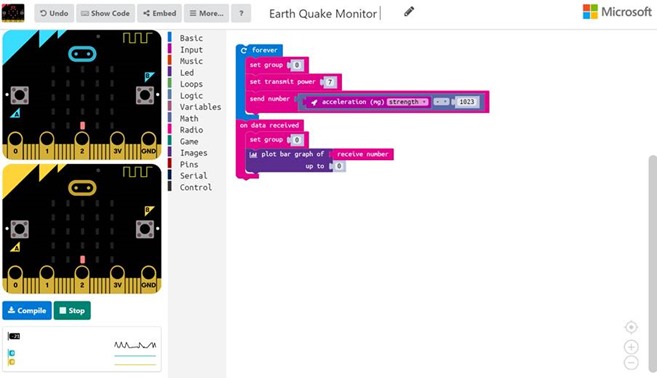
What we want to do now is build our siesmoraph for this we need two Micro:bits one will be receiver and one will be monitor.
The monitor will monitor for movements and transmit any movement via Bluetooth to the receiver Micro:bit which will then stream the data over USB cable via your PC to the Azure Cloud.
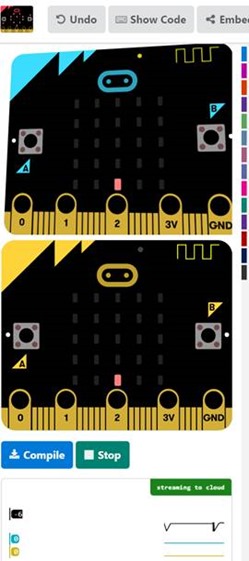
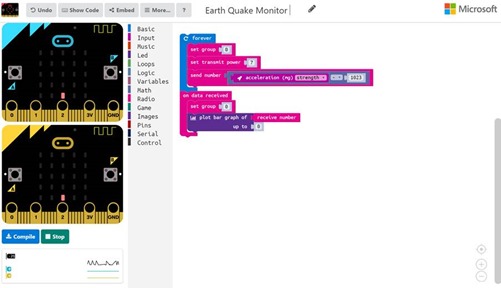
Plug in a second Micro:bit. Change the code to match the image below and compile onto both the Micro:bits. Notice how I now have two simulated Micro:bits and two live data streams.
You will be issued a group number 1 – 100 please ensure you use this group number to ensure your micro:bits communicate with each other.
Add a battery to one of the Micro:bits and then disconnect it from your PC. If you keep one Micro:bit very still and tap the second one you should see how the graph on the second Micro:bit changes in reaction.
Step 4 – Streaming your Data to the Azure cloud
To stream your data you will need to have Office 2016 installed.
Click on the box containing the live data and then press start.
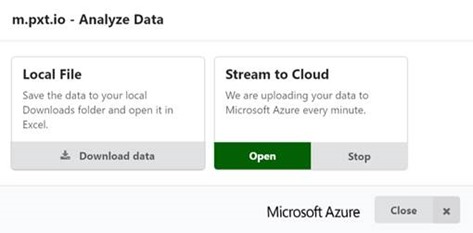
This will start the streaming service; it should now say “Streaming to Cloud”
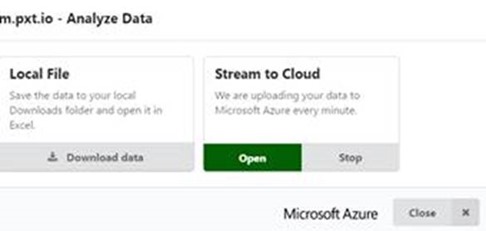
Click on the “stream to cloud” wording to open the stream and click open (at this point you could choose to download a csv of the data stream)
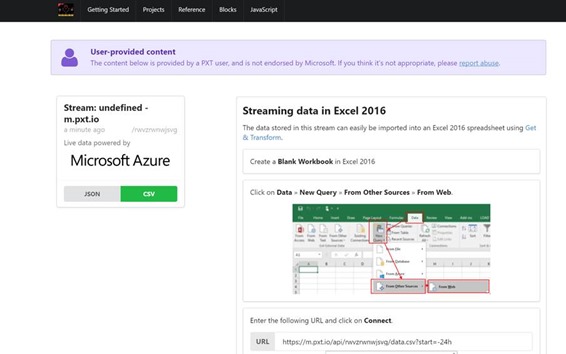
Select open you will be presented with some instructions, scroll down these until you find the stream URL and copy this address.
Simply follow the instructions on this page
Step 5. Streaming data in Excel 2016
The data stored in this stream can easily be imported into an Excel 2016 spreadsheet using Get & Transform.
Create a Blank Workbook in Excel 2016
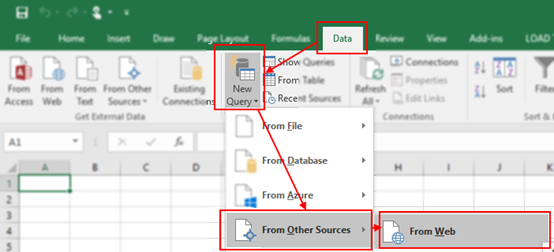
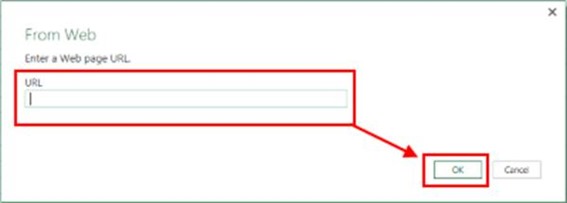
Click on Data » New Query » From Other Sources » From Web.
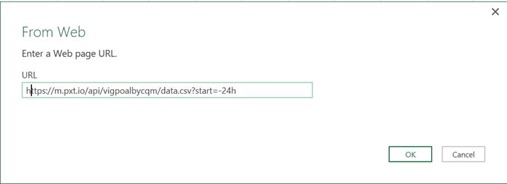
Enter the following URL and click on Connect.
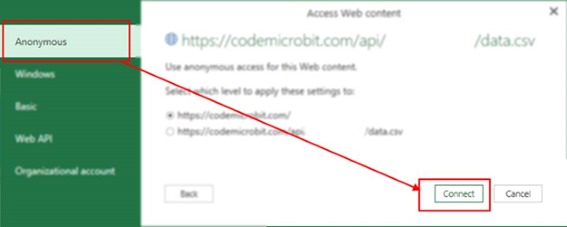
Select Anonymous and click Connect.
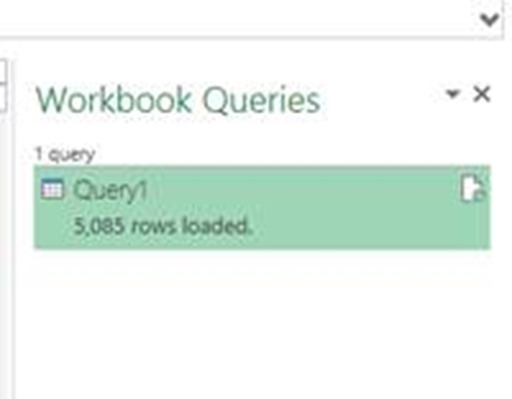
Click on Load.
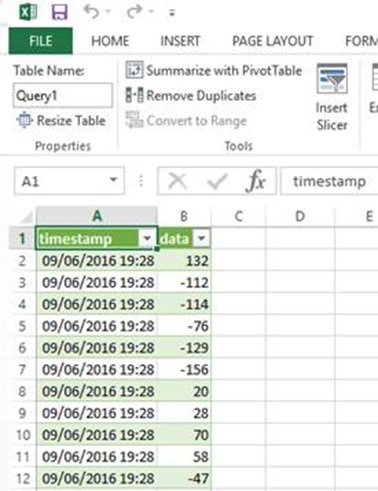
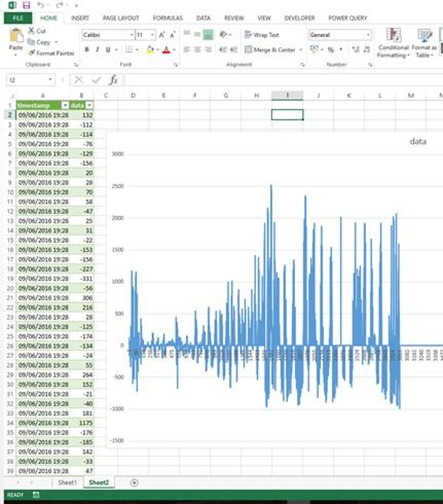
After a few seconds your data stream should appear
Graph your data in the normal way.
The data is the live data being streamed of the Micro:bit acting as the monitoring device.
You can update the data at any time by right clicking on the Query and selecting refresh – The data is uploaded to Azure every minute.
That’s it – one live streaming remote Seismograph.
Step 6. Turning off your Azure Streaming
When your happy with the data you have collected simply select Stop
The streaming to cloud image disappears from the screen


