SharePoint 2010 Performance Dashboard - Server Performance Reporting(Post 1/2)
In this post, I will talk about my SharePoint Performance Dashboard Project. It has mainly two major types of reporting features, Part 1. CPU Monitor, Memory Monitor, Top Users of the farm, Top Site Collections in the farm and many more and Part 2. List of content database with the size - for each web application, per content database how many site collections are there and what is the quota of each site collection and how much is used out of it.
So this project was planned in two parts, 1. Server Performance Reporting 2. Farm Content Size Reporting
Considering the length of the information, I will divide each part into two posts, so lets start with Part 1. Server Performance Reporting
For this functionality, We wanted mainly five types of reporting
- CPU trend in SharePoint servers in the farm for last 10 days
- Memory trend in SharePoint servers in the farm for last 10 days
- Top users of the farm
- Top Site Collections of the farm
- Tools used for the access
To begin with, I did my initial research in SharePoint’s Usage and Health data collection functionality. I studied how this functionality is and what type of information it collects. For more information about this functionality, please refer to Configure usage and health data collection (SharePoint Server 2010)
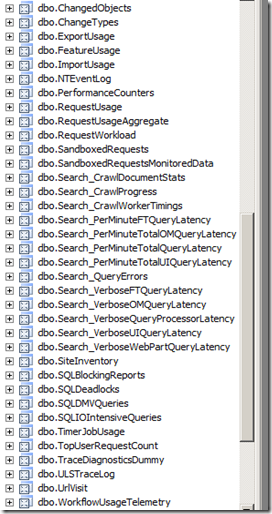
In WSS_Logging database, we have various views available and it really contains very useful information, it’s the data source for our reporting in this part.
Also, I evaluated SharePoint Diagnostic Studio 2010 (SPDiag 3.0) (SharePoint Server 2010). Based on it and by checking the various views from WSS_logging database I could derive all the necessary SQL queries that are required to get various performance information about each server in the farm.
CPU Monitor :
Query :
 SELECT
     MachineName, LogTime, Value
 FROM
     PerformanceCounters
 WHERE
 (counterid in
     (select id from PerformanceCountersDefinitions
     where
     category = 'Processor'
     and Machine in ('sharepoint') –- Add your server names of the SharePoint farm here
     )
 )
 and (LogTime between GETDATE() - 10 and GETDATE())
 order by Machinename,logtime
Memory Monitor
Query :
 SELECT
     LogTime,    [MachineName], [CounterId]
     ,(convert(decimal(10,1),((14336-[Value]) / 1024)) / 14) * 100 'Value'
 FROM
     [PerformanceCounters]
 where
 CounterId in (    select id from PerformanceCountersDefinitions
         where
         category = 'Memory'
         and
         Machine in ('sharepoint') –- Add your server names of the SharePoint farm here
 )
 and (LogTime between GETDATE() - 10 and GETDATE())
 order by [MachineName],[LogTime]
Top Users of the farm
Query :
 SELECT
          TOP (10) [Username], SUM(RequestCount) AS 'RequestCount'
 FROM
          TopUserRequestCount
 WHERE
          (LogTime BETWEEN GETDATE() - 10 AND GETDATE())
 GROUP BY UserName
 ORDER BY 'RequestCount' DESC
Top URL/Site Collection Requests
Queries :
 SELECT  top 10
     SUM(duration) AS requests,
     SiteUrl AS Url
 FROM
     RequestUsage
 where
     (LogTime between GETDATE() - 10 and GETDATE())
     and SiteUrl not like '%_vti_bin%'
     and SiteUrl not like '%.axd%'
     and SiteUrl not like '%.asmx%'
     and SiteUrl not like '%office_viewing_service_cache%'
     and SiteUrl not like '%_layouts%'
 GROUP BY
     SiteUrl
 order by
     requests
 SELECT top 10
     Url,
     count([Count]) Visitcount
 FROM
     [UrlVisit]
 where
     (LogTime between (GETDATE() - 10) and GETDATE())
     and Url not like '%_vti_bin%'
     and Url not like '%.axd%'
     and Url not like '%.asmx%'
     and Url not like '%office_viewing_service_cache%'
     and Url not like '%_layouts%'

 group by
     Url
 order by
     Visitcount desc
Information about the other reporting and how I did the UI part & packaging, I have covered in my next post.
Comments
Anonymous
July 10, 2012
Good post! I have one question. Why you exclude '%_layouts%' pages from Top URL/Site Collection Requests select? If i want to know total pageviews i must exclude layouts pages? Web Analytics reports include layouts pages. When i trying to compare WA reports and RequestUsage (included layouts and exluded '%_vti_bin%' '%.axd%' '%.asmx%' '%office_viewing_service_cache%'), RequestUsage always show more data. May be i must exclude more pages from RequestUsage? ThanksAnonymous
July 11, 2012
Q: Why you exclude '%_layouts%' pages from Top URL/Site Collection Requests select? A: That was just a requirement, did not want to count any pages which endusers won't access. Q: If i want to know total pageviews i must exclude layouts pages? A: in that case probably you can remove all the where conditions so all the requests are counted Q: RequestUsage always show more data. May be i must exclude more pages from RequestUsage? A: Check with SPDiag 3.0 report, and see what other items you can filterAnonymous
October 20, 2013
Hi Tejas, Can I get follow data User Document Librabry Hit count(This is for Single Document, Specified) Suyog 25 Tejas 50 I have used below query SELECT [Url] ,[Count] as TotalHitCount FROM [WSS_Logging].[dbo].[UrlVisit] where [UrlVisit].Url like '%shared%20documents%' and logtime between DATEADD(DD,-20,GETDATE()) and GETDATE() however id does not give me UserName ? how can I get User also ?Anonymous
April 10, 2014
I think there may be something wrong with the memory query. I dont think a SharePoint WFE would register as 0% memory utilization for any period of time ever. Also, in SPDiag, I am showing 53% utilization on my wfe, which is correct. But the query above consistently gives me around 75%, which is wrong. Not sure why.


