Understanding Monitors in Opsmgr 2007 part II Aggregate Monitors
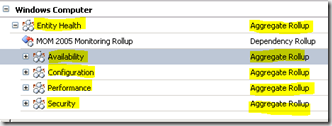
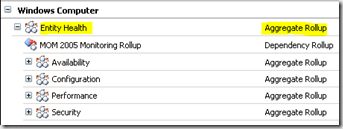
This is part 2 of my a series of posts describing monitors. The first post discussed unit monitors and can be found here. This post discusses aggregate monitors. As mentioned in the first post, unit monitors can be thought of as the workhorse of monitoring. Unit monitors are just that – a unit of monitoring. A self contained engine to monitor a specific item and reflect the result in terms of health state, alerting and diagnostic/recovery. Aggregates act as a collector and consolidator of information and ultimately reflect the collective result of unit monitors. For any defined class in OpsMgr there are 5 defined aggregate monitors – Entity Health, Availability, Configuration, Performance and Security. This is shown below for the Windows Computer object.
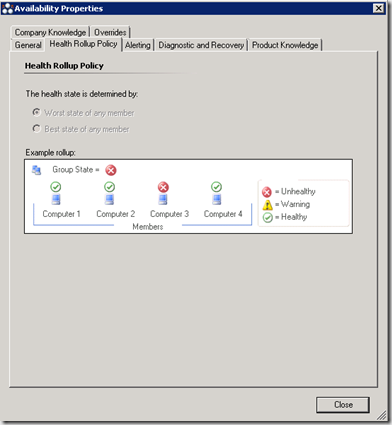
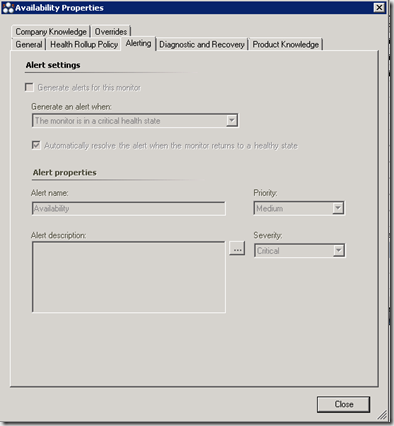
Until now you might have just thought of these as categories you can use for grouping similar unit monitors together – and they are useful for this – but these are much more than categories. If we look at the properties of the availability aggregate as an example we quickly see that this monitor itself can be an engine for alerting and is configurable to reflect the health of it’s contained unit monitors. We even have diagnostic and recovery options available for an aggregate monitor.
So when we configure a unit monitor we now understand that the setting to specify a parent monitor isn’t just cosmetic – it’s important. This setting directly dictates where an unhealthy unit monitor will have an impact. If we choose availability, the health state of our unit monitor (and all others under the availability aggregate) will be ‘watched’ and their collective health ultimately ‘rolled up' to and reflected on the aggregate itself. This offers some interesting possibilities. If, for example, you don’t want to generate an alert based on a single unit monitor but would prefer to alert only when all of the unit monitors are unhealthy, the aggregate allows you to do just that!
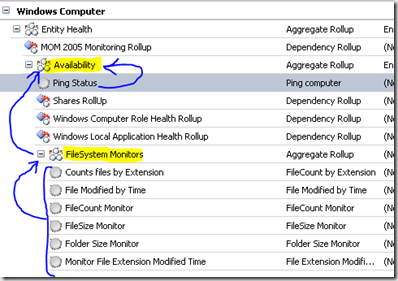
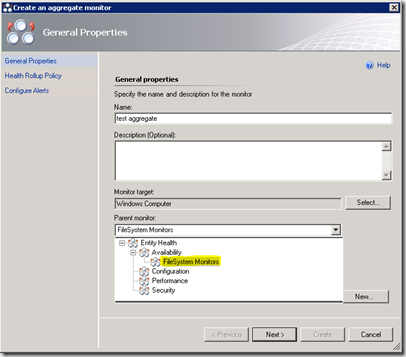
So we have the availability, configuration, performance and security aggregates and we understand that these are default aggregates that are part of every monitoring object and we understand that unit monitors that are configured under each directly ‘roll up’ their collective health to the aggregates. In addition to this, we can create our own aggregates and plug them into the monitoring structure. So, for example, if we wanted to subdivide our unit monitors under the availability aggregate we could create another aggregate inline as shown.
Here we have 6 unit monitors that operate and generate state that is collected by the FileSystem Monitors aggregate. So, the lower six unit monitors do not of their own operation have direct impact on availability health. In this example, if any of the 6 unit monitors under FileSystem Monitors go unhealthy that state will be reflected on the FileSystem Monitors aggregate itself and the health of the FileSystem Monitors object will be reflected forward to the general Availability aggregate.
OK, so we have the four categories of unit monitors and we know we can add our own aggregate monitors and specify where they should plug into the category model.
But, even these four top level categories of aggregate monitors themselves combine and are rolled up to the top most aggregate for a class – the entity aggregate.
So, ultimately, the overall health of the availability, configuration, performance, security and whatever other custom aggregates are in place on an object are taken into account based on their ‘watched’ unit monitors and rolled forward to the Entity aggregate. The Entity aggregate will reflect the overall health of the object in health explorer so at a glance we can tell if the monitored object, in this case Windows Computer, has any issue causing it to be unhealthy. I’ve put health explorer for a Windows Computer object next to the same object in the authoring > monitors view to show how they map together.
So we have the health of all unit monitors targeted to a particular class rolling their state forward to finally be shown in the health of the class itself. So once we have the health reflected on the class, where do we go from there? A common thought is that the health just continues to roll up along the relationship chain between objects. That is not correct. In terms of health state, the buck stops at the class itself. But, wait – you are about to scream that you have seen an unhealthy class roll up to and impact the health of a class higher up in the relationship chain….yes you have – but that isn’t done automatically. It requires dependency monitors and they will be the focus of part III of our series.
Comments
Anonymous
January 11, 2010
Nice article, clearly written. However, could you please help me understand a little further? The article shows you created an Aggregate rollup monitor called “FileSystem Monitors”. This contains six unit monitors. Did you have to create all of these? Is it possible to use existing unit monitors in and new aggregate rollup monitors? Thanks MarkAnonymous
January 12, 2010
The example given was just that - an example. there are lots of different scenarios where you could use aggregates - you couldhave aggregates roll to aggregates - you could have a single unit monitor under an aggregate, etc.
