Three Cheers for the Authoring Resource Kit Tools! Part I - The Workflow Analyzer
Have you ever been faced with troubleshooting OpsMgr and needed a way to trace the flow of a particular component – maybe a rule or monitor – or a discovery – to see what it was actually doing and what information was being submitted? Have you gotten frustrated with the ETL logs and the native OpsMgr events? Join the crowd! :)
I’m not saying that ETL or the OpsMgr event logs are bad – quite the contrary…there is a great deal of information in both – and in a troubleshooting scenario it’s often helpful to take logs or traces from a healthy agent and compare them to a broken agent – thats troubleshooting 101. In addition, the ETL tracing and event logging abilities of OpsMgr have just gotten better as we’ve progressed from RTM to R2!
But, what if we need that extra bit of deeper understand of whats happening ‘behind the scenes’? Enter the Authoring Resource Kit Tools – available here. The list of tools includes an MP Spell Checker, the cookdown analyzer, a workflow analyzer, a workflow simulator, a Visio add in for MP visualization, an MP difference tool, an updated Best Practice Analyser, etc.
In this series of blog posts I’ll highlight three of the tools that are of particular interest to me – the workflow analyzer, the workflow simulator and the cookdown analyzer.
Workflow Analyzer
As mentioned above, ETL tracing is available in OpsMgr and can be used to solve/diagnose many issues – and the ETL traces can be quite detailed – which is also their challenge! Because these traces can be so busy and detailed it can take some time to get comfortable reading/interpreting them. Additionally challenging is the fact that different levels of tracing can be configured as well as different output formats. Wouldn’t it be cool if you could pick out the workflow of interest and focus tracing on that component only? The Workflow Analyzer does just that!
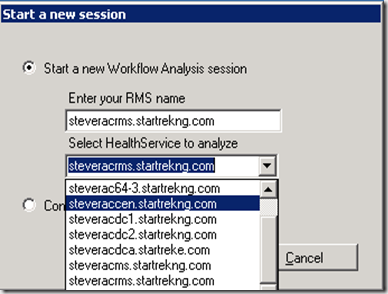
Launching the Workflow Analyzer requires two inputs – the name of your RMS and the health service you want to analyze.
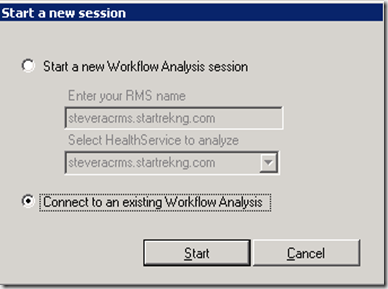
Note that the analyzer can be run on the RMS itself – or it can be configured to analyze an agent workflow. If you run the trace tool on the RMS, start a new analysis session and choose the RMS health service, tracing starts immediately since the workflow of interest is running on the RMS. If you launch the Analyzer on the RMS and choose a remote health service then all of the configurations will be made to start tracing on the remote health service but to actually see the tracing output you will need to launch another instance of the Analyzer on the remote workstation and select to ‘connect to an existing Workflow Analysis’ as shown.
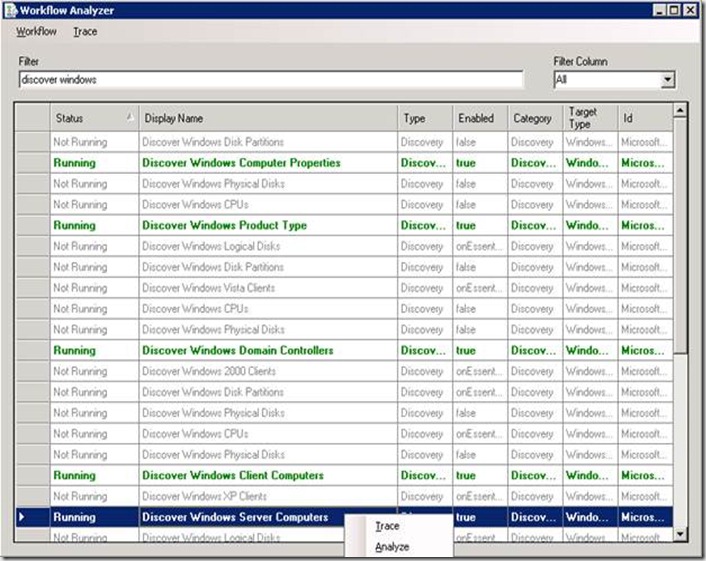
When a new analysis session is started and the RMS/target health service are selected, a list of all of the workflows that the target health service knows about will be listed. Those that are running will be shown in green, those that are not running will be grey and those with a problem condition will be shown in red. The status column will give the state of each workflow. As you can imagine, showing an example of every conceivable workflow would be a big undertaking – but we will show a couple of samples to demonstrate the power of the analyzer.
Discovery Workflow
In the example above we select a discovery workflow. Right-clicking on the workflow gives two options – trace and analysis. The analysis option gives a detail screen with relevant information about the workflow and any configurations in place – such as overrides applied, the MP storing the workflow, etc.
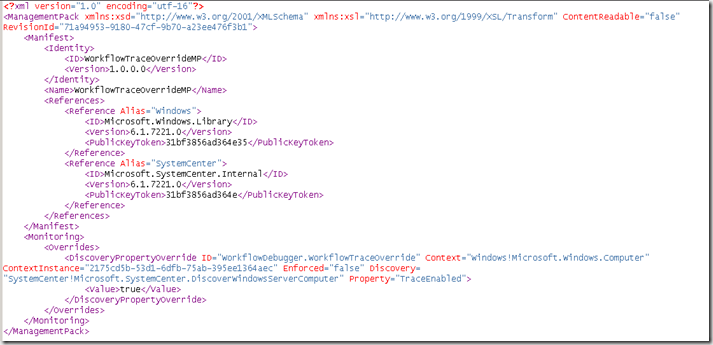
The Trace option begins a detailed trace of all actions taken by the chosen workflow. From the screenshot below note that before tracing begins an override has to be configured on the workflow to allow tracing to start. When tracing is selected on a workflow the override is introduced in a management pack called the WorkflowTraceOverrideMP (which only exists for the duration of the tracing) that can be seen in the Health Service State\Management Packs folder on the agent where tracing is taking place. If you catch the WorkflowTraceOverrideMP during tracing and open it you will see the simple XML introduced to apply the tracing override. I show a sample of the WorkflowTraceOverrideMP below. Note that if you open this MP directly the XML will likely not be formatted nicely. This is fairly easy to fix since the MP is so simple.
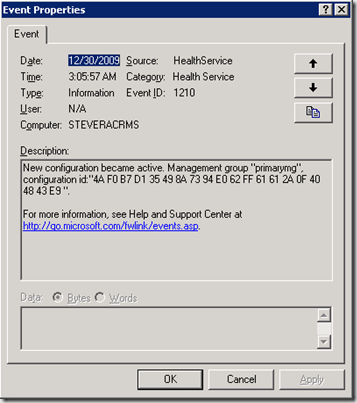
The use of an override to initiate tracing is important to understand because before any testing can be traced the override must make it down to the target health service. This override will come down as part of a standard configuration update. If your environment is experiencing delayed configuration updates, getting the override down to the target health service may also be delayed. Make sure you see an event 1210 indicating that the new configuration has become active.
Once the event 1210 has been received, begin reproducing the activity you wish to trace. In the case of our discovery workflow I introduced an override on it temporarily so that is runs every minute – which makes capturing the workflow activity much quicker. The trace output from the workflow is below.
Note the detail received as the workflow runs – first we see a WMI query being executed along with the output from the query being sent as a dataitem. If we want to see a particular line of data in more detail, just double-click on it and the XML representation of the data will be displayed as shown.
Event Workflow
Another common example might be tracing a workflow that should match and act on an event. The trace output below is a simple example of the kind of tracing you would see from such a workflow. Note that as the trace proceeds and events are seen we specifically call out whether we consider each event a match or not.
I’ll stop here – and I know there is a limited number of examples – but take some time to get familiar with this tool – it can really help understand how things are working inside of a workflow.
Comments
- Anonymous
June 30, 2010
The comment has been removed - Anonymous
June 30, 2010
The analyzer is part of the authoring resource kit install but it is not one of the tools added as a part of the drop down in the authoring console. Rather, the analyzer is a standalone tool that can be launched from the start menu under authoring tools.
![clip_image002[9] clip_image002[9]](https://msdntnarchive.z22.web.core.windows.net/media/TNBlogsFS/BlogFileStorage/blogs_msdn/steverac/WindowsLiveWriter/Workflowanalyzer_14EF4/clip_image002%5B9%5D_thumb.jpg)
![clip_image002[11] clip_image002[11]](https://msdntnarchive.z22.web.core.windows.net/media/TNBlogsFS/BlogFileStorage/blogs_msdn/steverac/WindowsLiveWriter/Workflowanalyzer_14EF4/clip_image002%5B11%5D_thumb.jpg)
![clip_image002[13] clip_image002[13]](https://msdntnarchive.z22.web.core.windows.net/media/TNBlogsFS/BlogFileStorage/blogs_msdn/steverac/WindowsLiveWriter/Workflowanalyzer_14EF4/clip_image002%5B13%5D_thumb.jpg)
![clip_image002[15] clip_image002[15]](https://msdntnarchive.z22.web.core.windows.net/media/TNBlogsFS/BlogFileStorage/blogs_msdn/steverac/WindowsLiveWriter/Workflowanalyzer_14EF4/clip_image002%5B15%5D_thumb.jpg)
![clip_image002[17] clip_image002[17]](https://msdntnarchive.z22.web.core.windows.net/media/TNBlogsFS/BlogFileStorage/blogs_msdn/steverac/WindowsLiveWriter/Workflowanalyzer_14EF4/clip_image002%5B17%5D_thumb.jpg)