Collecting performance data with PSSDIAG for SQL Server on Linux
Reviewed by: Suresh Kandoth,Rajesh Setlem, Steven Schneider, Mike Weiner, Dimitri Furman
When analyzing SQL Server performance related issues, customers often have their tools of choice, which can be a feature within the product, a third-party performance monitoring tool, or a home-grown tool that assists in monitoring live performance. For live monitoring, in the SQLCAT lab we use a home grown tool described in this blog. However, when our customers have a performance issue, we, just like support engineers and consultants, can’t always have them ship their third-party tools or associated data, and hence need a way to collect performance related data for post mortem analysis.
PSSDIAG is a popular tool used by Microsoft SQL Server support engineers to collect system data and troubleshoot performance issues. This is a well-known tool for SQL Server on Windows, and we needed equivalent functionality on Linux. PSSDIAG data collection for Linux is now available here. It is a set of bash scripts that collect all the necessary data for troubleshooting performance problems, similar to PSSDiag on Windows.
As part of the default data collection, these scripts:
- Collect configuration information about the machine.
- Collect performance data from the operating system’s perspective using the sysstat package.
- Collect DMV output of sys.dm_os_performance_counters and other DMVs required to troubleshoot various performance scenarios.
- Optionally you can turn on other collectors such as Extended Events or custom script collectors.
- You may be prompted at the start to install dependent packages if you don’t have them installed, which are also listed in the Readme.
Steps to collect data through PSSDiag on Linux
To collect data and analyze performance issue(s), follow the steps below:
1. Create a folder and download/unzip the pssdiag release version.
mkdir /pssdiag
cd /pssdiag
curl -L https://github.com/Microsoft/DiagManager/releases/download/LinuxRel170810/pssdiag.tar | tar x
Note: The pssdiag folder and its parents must have r+x (Read and Execute) permissions for the mssql account if collecting extended events. By default, on RHEL, the /home/user directory does not have those permission. Either grant permissions or create the folder elsewhere. See the Readme for additional details.
2. PSSDIAG has a configuration file which dictates what data is collected, namely pssdiag_collector.conf. If you need to change the defaults on what data is collected, you may have to modify the configuration options in this file. They are documented both in the Readme and the configuration file itself. A snippet of the configuration file is below:
3. To start the data collection process, execute the command below. NOTE: Some of the data collection does require elevated privileges and therefore should be run as SUDO as shown below:
sudo /bin/bash ./start_collector.sh
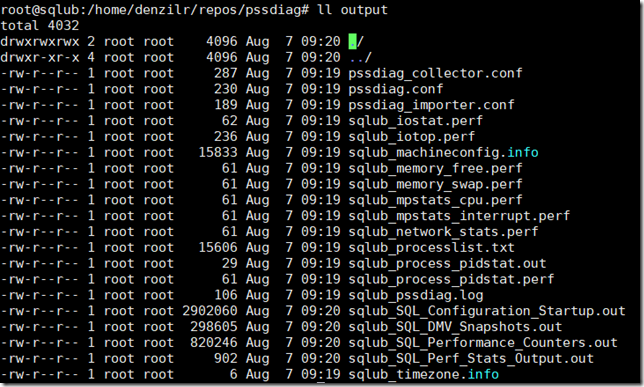
4. This will create an output folder under the current folder to store all the data collected.
5. After you have reproduced your problem or captured data for the timeframe encompassing the problem, stop the collector. Invoke the script below which stops the collection and zips up all the files
/bin/bash ./stop_collector.sh
You should get the confirmation message such as the one below, pointing to the location of the zipped output file.
***Data collected is in the file output_denzilrredhat_08_07_2017_04_04.tar.bz2 ***
Additional details: https://github.com/Microsoft/DiagManager/blob/master/LinuxPSSDiag/Readme.txt
Configuring a custom XE collection
By default, collection of Extended Events is disabled. You can enable extended event collection by setting the COLLECT_EXTENDED_EVENTS option in the configuration file to YES. By default, that would create an extended event session capturing batch_completed and rpc_completed events only. If you want to change the extended event session configuration, you will have to modify the pssdiag_xevent.sql script, and put the extended event session definition there, leaving the extended event session name (PSSDIAG_Xevent) unchanged.
Configuring a custom script
In order to collect an additional TSQL script, name the script SQL_Custom_Script.sql and in the pssdiag_collector.conf set the option CUSTOM_COLLECTOR=YES.
PSSDiag Data Analysis
This collected data can be analyzed by using a tool called SQLNexus in the same way as with PSSDiag for Windows: https://github.com/Microsoft/SqlNexus/releases. In the near future, we will be adding a tool that converts the OS metrics (mpstat, iostat, pidstat, and network stats) into a perfmon BLG file, to visualize it in PerfMon for Windows folks who use/prefer PerfMon. As an alternative, you can use any of your favorite shell scripts to analyze the collected data.
Known Issue: When analyzing data collected on a Linux machine with SQLNexus, one of the first things you may notice is the CPU in one of the charts obtained from sys.dm_os_ring_buffers shows CPU consistently at 100%. This is because the sys.dm_os_ring_buffers CPU numbers are not yet integrated into SQL Server on Linux. Other than that, all the other DMV data collected can be visualized.
As you use this to collect performance data, let us know how we can improve it.
Denzil Ribeiro & Suresh Kandoth


