Load Test Summary Report
This post will give you an overview of the new Load Test Summary Report available in the Orcas release of Visual Studio. One piece of feedback we received with analyzing a load test was it would be nice to have a snapshot of how the load test did. It would be great to be able to look at a report and get a feel for how the tests ran, how the servers held up, and find other summary information. For the orcas release we added a load test summary report which will do just that.
The summary report is available in the Load Test post run UI and will be the first screen you see. So to get to this report, you just open a load test result. Check out this blog post for an easy way to find load test results with the new Results Management dialog: Results Managment From this summary report, you will be able to navigate to other tables and graphs that you are interested in getting more information on. For example, you may see one of the server machines had a very high % Processor time. If you click on the machine, it will jump you to a graph with this counter.
The summary report can be thought of in 2 parts. At the top is some high level information about the load test. You will see the following type of information: Test Name, User Load, Duration, Start Time, End Time, Requests/Sec, Tests/Sec, Avg Test Time, Avg Page Time, etc. Then you will also up to three tables that have the Top 5 slowest Pages, Tests and SQL Operations. This part of the report looks like the following:
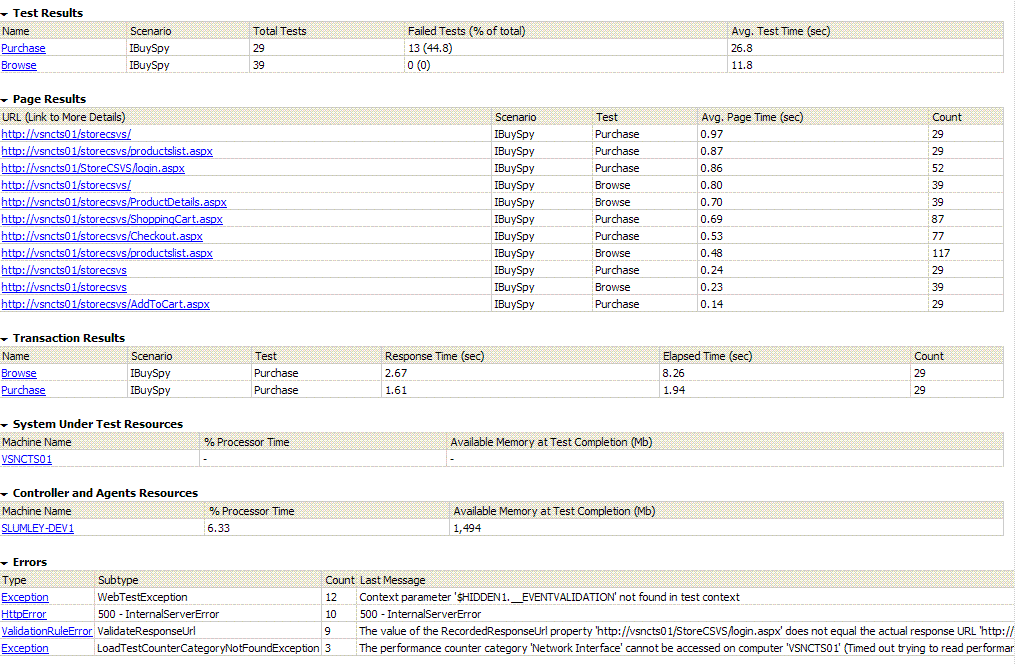
The second part of the report is a little more detailed. It gives you more information about each of the tests, pages, transactions, Servers and errors. Here is what that part of the report looks like:
This report is done in HTML format, so you could save the report to an HTML file and add it to a web site or copy the report and add it to a status email.
This report should give you a snapshot of your load test and help provide the answer to the question of what should be analyzed. This was added for the Beta1 release of Orcas so if you download the beta, you can use this today!
Comments
Anonymous
June 14, 2007
Check out this blog post for more information on the Load Test Summary report feature available in OrcasAnonymous
June 14, 2007
The comment has been removedAnonymous
June 28, 2007
Lot's of new stuff for web, load, and unit tests in Orcas. Follow the links for more info. Web test ·Anonymous
August 17, 2007
Orcas - Visual Studio Team System 2008 - new features coming for Web and Load testing and a feature ofAnonymous
October 23, 2007
Technorati tags: VSTS , Team Test , Ed Glas A giant thank you goes out to Mr Glas for consilidating andAnonymous
December 17, 2007
Visual Studio Team System for Testers Content Index for Web Tests and Load Tests Getting Started OnlineAnonymous
February 03, 2008
Hi. Where can I find more information on the difference between 'response time' and 'elapsed time' for the transaction results section in the load test summary report ? Regards.Anonymous
March 09, 2009
I have been running many load tests using vsts 2008 and creating many reports user the vsts report server. I just recently noticed that the transaction results on the Page Summary do not match with the results I get when I create a counters/time report for the same transaction. Does one report use data including the warmup time? The test is running for an hour + 3 minutes of warmup. Thanks for any info.Anonymous
February 14, 2012
In the summary report: for requests per second, is that RPS sent by the VU users or is it RPS served by the web server ?Anonymous
April 27, 2012
Thanks a lot.....This article Helped me to retrieve files in time

