Groups and Distributed Applications with 3-State Rollup
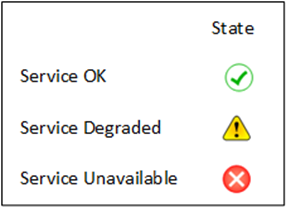
When you work with System Center Operations Manager 2012 one of the things that you might have run into is the limitations it has on rolling up state. Sure you can choose between the Best State, Worst State and a percentage value in between, but what I often hear is: "Why can't we turn the group or Distributed Application State yellow when only one or only non-critical components are affected and red only when we lose service availability? In other words, or easier graphically, you want this:

Unfortunately, SCOM 2012 does not give you this rollup variation out of the box.
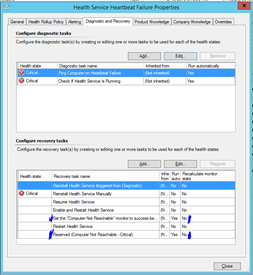
After just accepting this for the longest time, I have tried to "simulate" this behavior with normal SCOM components. I remembered that the "Health Service Heartbeat Failure" monitor has some Recovery Tasks that forcibly set a monitor's state.

So as one does trying to find out what's in a sealed MP, I exported the Microsoft.Systemcenter.2007 Management Pack from PowerShell and looked for the WriteActionModuleType. This is the one:
<WriteActionModuleType ID="Microsoft.SystemCenter.Health.SetStateAction" Accessibility="Internal" Batching="false">
<Configuration>
<IncludeSchemaTypes>
<SchemaType>Health!System.Health.AlertSchema</SchemaType>
<SchemaType>System!System.ManagedEntityKeysSchema</SchemaType>
</IncludeSchemaTypes>
<xsd:element name="ManagementGroupId" type="xsd:string" xmlns:xsd="https://www.w3.org/2001/XMLSchema" />
<xsd:element name="MonitorId" type="xsd:string" xmlns:xsd="https://www.w3.org/2001/XMLSchema" />
<xsd:element name="ManagedEntityTypeId" type="xsd:string" xmlns:xsd="https://www.w3.org/2001/XMLSchema" />
<xsd:element name="KeyProperties" type="System.ManagedEntityKeys" xmlns:xsd="https://www.w3.org/2001/XMLSchema" />
<xsd:element name="HealthState" type="System.Health.AlertHealthState" xmlns:xsd="https://www.w3.org/2001/XMLSchema" />
</Configuration>
<ModuleImplementation Isolation="Any">
<Native>
<ClassID>44cbc334-8b5f-4cb6-bee0-6bdcbc80e8d5</ClassID>
</Native>
</ModuleImplementation>
<InputType>System!System.BaseData</InputType>
</WriteActionModuleType>
As you can see, this is using a native module that we do not have any deeper insight into, it's is stored in a DLL. But we can refer to it by the ClassID I marked yellow. We could even use the module directly if it were not marked as "Internal". So the way to go for this is to implement a similar WriteActionModuleType and create a WriteActionModule using it. Looking around other blogs a bit, I found that someone had already done this:
Roman Zolotov has already created this and wrote about it in the following blog post:
https://blogs.technet.com/b/scpferublog/archive/2014/11/07/how-to-change-the-state-of-monitors-part-2.aspx
If you look at his Management Pack, he has taken exactly the same native module but created a "Public" implementation:
<WriteActionModuleType ID="Custom.Task.Library.Set.Monitor.State.WA" Accessibility="Public" Batching="false">
<Configuration>
<IncludeSchemaTypes>
<SchemaType>Health!System.Health.AlertSchema</SchemaType>
</IncludeSchemaTypes>
<xsd:element name="ManagementGroupId" type="xsd:string" xmlns:xsd="https://www.w3.org/2001/XMLSchema" />
<xsd:element name="MonitorId" type="xsd:string" xmlns:xsd="https://www.w3.org/2001/XMLSchema" />
<xsd:element name="ManagedEntityId" type="xsd:string" xmlns:xsd="https://www.w3.org/2001/XMLSchema" />
<xsd:element name="HealthState" type="System.Health.AlertHealthState" xmlns:xsd="https://www.w3.org/2001/XMLSchema" />
</Configuration>
<ModuleImplementation Isolation="Any">
<Native>
<ClassID>44cbc334-8b5f-4cb6-bee0-6bdcbc80e8d5</ClassID>
</Native>
</ModuleImplementation>
<InputType>System!System.BaseData</InputType>
</WriteActionModuleType>
And with that he created another WriteActionModuleType that we can then use to force any Monitor into any state we want.
<WriteActionModuleType ID="Custom.Task.Library.Set.Monitor.Action" Accessibility="Public" Batching="false">
<Configuration>
<IncludeSchemaTypes>
<SchemaType>Health!System.Health.AlertSchema</SchemaType>
</IncludeSchemaTypes>
<xsd:element minOccurs="1" name="MonitorId" type="xsd:string" xmlns:xsd="https://www.w3.org/2001/XMLSchema" />
<xsd:element minOccurs="1" name="HealthState" type="System.Health.AlertHealthState" xmlns:xsd="https://www.w3.org/2001/XMLSchema" />
</Configuration>
<ModuleImplementation Isolation="Any">
<Composite>
<MemberModules>
<WriteAction ID="WA" TypeID="Custom.Task.Library.Set.Monitor.State.WA">
<ManagementGroupId>$Target/ManagementGroup/Id$</ManagementGroupId>
<MonitorId>$Config/MonitorId$</MonitorId>
<ManagedEntityId>$Target/Id$</ManagedEntityId>
<HealthState>$Config/HealthState$</HealthState>
</WriteAction>
</MemberModules>
<Composition>
<Node ID="WA" />
</Composition>
</Composite>
</ModuleImplementation>
<InputType>System!System.BaseData</InputType>
</WriteActionModuleType>
Another idea taken from Roman's blog post is to use this Module type in a Recovery Action of a dependency monitor. This opened up the way to achieve what I had set out to go for. Now I could create the following…

If this is a little overwhelming, let me start by explaining the scenario.
The Scenario
During a Service Mapping engagement at your customer, you heard …
- … that they have four Print Servers that make the Print Server Service
- … that the only thing important is the Print Spooler service on those 4 servers
- … that the CIO does not care about the individual servers but cares a lot about the print service, as they need it to print the delivery papers and invoices for their customers
- … that the service will (somehow) still be available as long as one Print Server is up and running, but that they should know as soon as the first Print Spooler service goes down in order to proactively avoid a service outage
- … that they want to present the appropriate state information to different audiences like End Users, Service Owners, Help Desk, etc.
Especially the last requirement connects this with the topic of this post. Depending on the audience, we need to represent the state of the Print Service in different ways:
- End Users only need the Red/Green traffic light. Presenting a degraded state might lead to increased help desk calls and leaves the end user in a confused state. For them the service is purely binary, either it prints or it doesn't.
- Print Service Owner / Support needs a more granular view. They need to be made aware that a part of the overall Print Service is down and that not reacting might lead to a total service outage. So they need a Red/Amber/Green traffic light. They also need a view that represents the state of the components of the Print Service in order to identify the origin of a service degradation.
- Other groups may or may not fit in either of those categories. CxOs, Owners of Business Services depending on the Print Service, Department Heads, etc. all may be interested in various levels of depth on the service health. Their requirements need to be taken into consideration as well.
The Implementation
As per requirement 2, we need to make sure we monitor the Print Spooler service on the 4 Print Servers. The standard server build disables the Print Spooler service on all servers with the exception of the Print Servers. So the WMI Query
select * from Win32_Service where Name = "Spooler" and StartMode = "Auto"
will find those servers. So we can use this to seed discover instances of the newly defines "Print Service Host" Class. As we are only interested in the Print Spooler Windows Service we then discover the service with a similar discovery on just those Print Service Hosts.
select * from Win32_Service where Name = "Spooler"
This will now give us the four Print Spooler Services we are interested in.

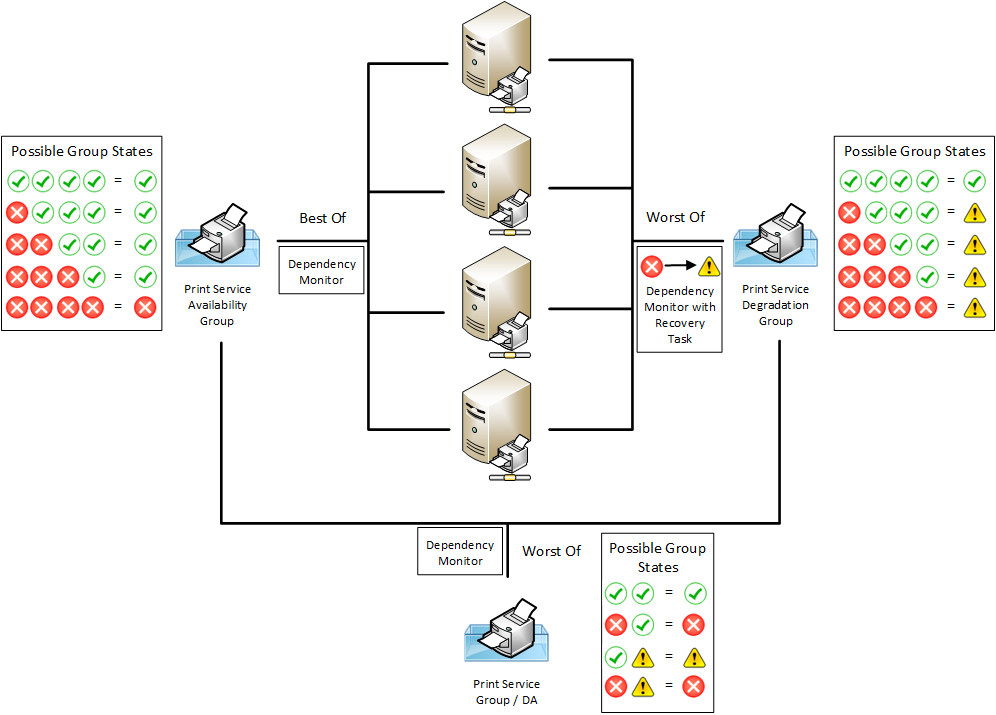
Now from the Service Availability perspective we need to group those with the "Best Of" Rollup algorithm chosen, from a Service Degradation perspective we need to use the "Worst Of" algorithm. So let's do both, we create two identical groups from the same objects. As Group Objects do not rollup state by default, we also need to create a Dependency Monitor for either of them. In here we then choose the different Rollup algorithms.
|
<DependencyMonitor ID="ThreeStateRollup.PrintServiceAvailabilityDependencyMonitor" Accessibility="Internal" Enabled="true" Target="ThreeStateRollup.PrintServiceAvailabilityGroup" ParentMonitorID="Health!System.Health.AvailabilityState" Remotable="true" Priority="Normal" RelationshipType="SCIG!Microsoft.SystemCenter.InstanceGroupContainsEntities" MemberMonitor="Health!System.Health.AvailabilityState"> <Category>Custom</Category> <Algorithm>BestOf</Algorithm> <MemberUnAvailable>Error</MemberUnAvailable> </DependencyMonitor> |
|
<DependencyMonitor ID="ThreeStateRollup.PrintServiceDegradationDependencyMonitor" Accessibility="Internal" Enabled="true" Target="ThreeStateRollup.PrintServiceDegradationGroup" ParentMonitorID="Health!System.Health.AvailabilityState" Remotable="true" Priority="Normal" RelationshipType="SCIG!Microsoft.SystemCenter.InstanceGroupContainsEntities" MemberMonitor="Health!System.Health.AvailabilityState"> <Category>Custom</Category> <Algorithm>WorstOf</Algorithm> <MemberUnAvailable>Error</MemberUnAvailable> </DependencyMonitor> |
So far, we have two groups where one (Availability Group) stays green as long as one Print Spooler service is green and the other (Degradation Group) turns red as soon as the first Print Spooler service goes down. So the Availability Group's State would serve well for our End Users and everyone who only needs to Red/Green Service State. But we do not yet cover the needs of the Red/Amber/Green requirements that the Print Service Owners and Supporters want. For this the WriteActionModuleType introduces in the beginning comes into play. We now define a Recovery for the Dependency Monitor of the Print Service Degradation Group:
<Recovery ID="ThreeStateRollup.ForceWarningRecovery" Target="ThreeStateRollup.PrintServiceDegradationGroup" Monitor="ThreeStateRollup.PrintServiceDegradationDependencyMonitor" Accessibility="Public" Enabled="true" ExecuteOnState="Error" Remotable="true" ResetMonitor="true" Timeout="300">
<Category>Custom</Category>
<WriteAction ID="WA" TypeID="CTL!Custom.Task.Library.Set.Monitor.Action">
<MonitorId>$MPElement[Name="ThreeStateRollup.PrintServiceDegradationDependencyMonitor"]$</MonitorId>
<HealthState>Warning</HealthState>
</WriteAction>
</Recovery>
The WriteActionModuleType comes from Roman's Management Pack that we have imported. Alternatively, we could of course create our own version of the WriteActionModuleType within our Print Service Management Pack.
Now we force the Print Service Degradation Group's state into "Warning" when the regular rollup changes it to "Error", i.e. whether we have one, two, three or four Print Spooler services down, our Group state is always Amber.
All we need to do now to have the 3-State Rollup is to group our two new groups together, add a Dependency monitor and use the "Worst Of" rollup algorithm. This will then lead to the following situation:

The first column is the Availability Group which by definition can only be either Red or Green. The second column is the Degradation Group which we now forced into being either Amber or Green. The "Worst Of" algorithm then turns the Print Service State to Yellow when one, two or three Print Spoolers are down and to Red when the Service Availability turns Red, i.e. the Print Service is down.
Dashboards
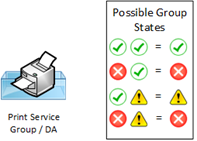
So this now allows us to present the State of the Service to different audiences. The Print Service box for the "Contoso Service Desk Dashboard" on the left presents the state of our new 3-State Rollup Print Service Group Object, the Print Service box in the "Contoso End User Dashboard" on the right presents the state of the Print Service Availability Group.


Comments
- Anonymous
November 02, 2015
Really nice solution my friend. I liked the approach ...

