Mine the ULS logs for query latency - Redux
I was reading a blog posting from Dan Blood, Sr. Test Engineer at Microsoft, on how to mine the ULS logs for query latency. If you haven’t read the post yet, I encourage you to do so. It has a wealth of information in it.
I was recently working a similar issue where I needed to do this exact thing and I discovered a couple of improvements that I’d like to share on the process that Dan has put together. I think it will help simplify.
When running Dan’s script against a sizeable amount of ULS data, I found that it produced a tremendous amount of data. Later in the analysis portion, that data will be grouped by hour; so, I decided to be a bit proactive and do it up front. Here’s the modified logparser script that I used.
ULSQueryLatency.sql
1: --
2: -- logparser file:ULSQueryLatency.sql?source=*.log+destination=Latency.csv -i:TSV -oCodepage:-1 -iTsFormat:"MM/dd/yyyy hh:mm:ss.ll" -fixedSep:ON -o:csv
3: --
4: -- To restrict to start/end hours of the day, uncomment the
5: -- QUANTIZE statements in the WHERE clause and
6: -- pass in the startofday and endofday value. For example,
7: --
8: -- logparser file:ULSQueryLatency.sql?source=*.log+destination=Latency.csv+startofday="08:00:00"+endofday="18:00:00" -i:TSV -oCodepage:-1 -iTsFormat:"MM/dd/yyyy hh:mm:ss.ll" -fixedSep:ON -o:csv
9: --
10: --
11: SELECT
12: QUANTIZE(Timestamp, 3600) AS Hour,
13: AVG(TO_REAL(Extract_token(Message, 7, ' '))) AS TotalQPTime,
14: AVG(TO_REAL(Extract_token(Message, 8, ' '))) AS v2,
15: AVG(TO_REAL(Extract_token(Message, 9, ' '))) AS v3,
16: AVG(TO_REAL(Extract_token(Message,10, ' '))) AS v4,
17: AVG(TO_REAL(Extract_token(Message,11, ' '))) AS TimeSpentInIndex,
18: SUM(TO_REAL(Extract_token(Message,12, ' '))) AS v6,
19: SUB(v4, TimeSpentInIndex) AS JoinTime,
20: SUB(v3, v4) AS SecurityTrimmingTime,
21: CASE v2
22: WHEN 0.0
23: THEN 0.0
24: ELSE SUB(v2, v3)
25: END AS DuplicateDetectionTime,
26: SUB(TotalQPTime, v2) AS FetchTime
27: FROM
28: %source% TO %destination%
29: WHERE
30: Category = 'MS Search Query Processor' AND
31: Message LIKE '%Completed query execution with timings:%'
32: -- AND
33: -- (
34: -- QUANTIZE(TO_TIME(Timestamp), 3600) >= TIMESTAMP('%startofday%', 'hh:mm:ss') AND
35: -- QUANTIZE(TO_TIME(Timestamp), 3600) <= TIMESTAMP('%endofday%', 'hh:mm:ss')
36: -- )
37: GROUP BY Hour
Now, in my particular situation I needed to run this against several servers and report on their query latency individually. If this isn’t a requirement for you, then no need to spend the additional time.
Being the lazy sort that I am, I put together a little command script to handle the heavy lifting. The following assumptions are made:
- ULS logs are located in a folder and are in the standard named form of %COMPUTERNAME%-yyyymmdd-hhmm.log
- I have placed my logparser scripts in a folder that is referenced via the %LPQ% environment variable
SearchLatency.cmd
1: @if /i "%DEBUG%" neq "yes" echo off
2: REM
3: REM Generate data for Search Latency analysis
4: REM
5: @SET ServerList=SERVER01,SERVER03,SERVER04,SERVER05
6:
7: @ECHO Initializing...
8: FOR %%i IN (%ServerList%) DO @IF EXIST %%i-SearchLatency.csv DEL %%i-SearchLatency.csv /F /Q
9: @IF EXIST SearchResultsDetail.csv DEL SearchResultsDetail.csv /F /Q
10:
11: @IF EXIST data\*.LOG LOGPARSER file:%lpq%\SearchResultsDetail.sql?source=data\*.log+destination=SearchResultsDetail.csv -i:iisw3c -o:csv
12:
13: FOR %%i IN (%ServerList%) DO @IF EXIST ULSLogs\%%i*.log LOGPARSER file:%lpq%\ULSQueryLatency.sql?source=ULSLogs\%%i*.log+destination=%%i-SearchLatency.csv -i:TSV -iCodepage:-1 -iTsFormat:"MM/dd/yyyy hh:mm:ss.ll" -fixedSep:ON -o:csv
14:
15: @SET FileList=
16: @SET NumberOfSteps=
17:
18: @ECHO Complete!
This will produce a series of csv files, one per server, which can be easily imported into Excel. They should look something like the following:
You will note that it is grouped by hour instead of by data point as Dan’s script does. This allows me to handle larger data sets and generate a consistent amount of output data. Since we were going to end up grouping by hour in Excel, I decided to do it here instead :-).
How do I generate the pretty graph?
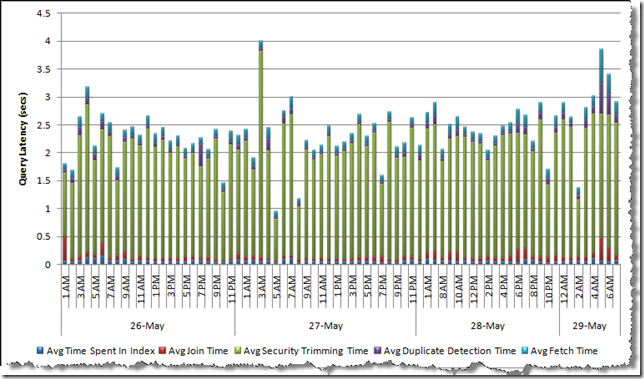
So, we’ve got the csv file…what do we do now? This is where the fun comes. We’re going to construct a pivot chart like the one Dan does. Since I had to figure out how to do this, I thought I’d share the process.
1. After importing the csv file into Excel, I typically will convert it to a table so that I can reference it by name as well as making it easier to read.
2. Next, let’s convert the Hour column into a more pleasing format. We do this by selecting the column and picking a custom format:
3. Next, we’re going to create a PivotChart
Let’s go ahead and let it go to a new worksheet. This will give us room to work.
4. We’re going to drag the following fields to the Pivot
Values
- TimeSpentInIndex
- JoinTime
- SecurityTrimmingTime
- DuplicateDetectionTime
- FetchTime
Axis Fields (Categories)
- Hour
When you’re done, it should look something like this:
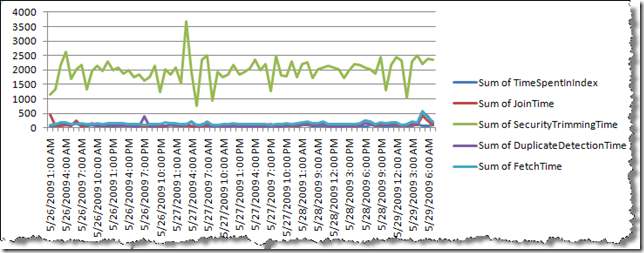
It should have also created a graph that looks like this (not quite what we’re after… yet)
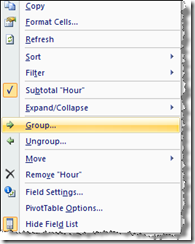
5. Next, we want to change up the grouping just a bit so that we can see by day/by hour detail. So, from the Pivot Table data, we’re going to select the Hour data and right-click to group the data.
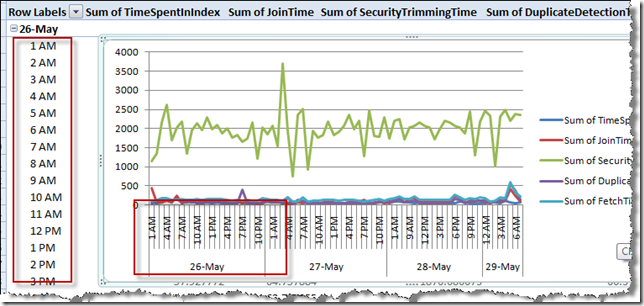
6. Next, we’re going to group by Days and Hours. This will change our our display and our graph slightly
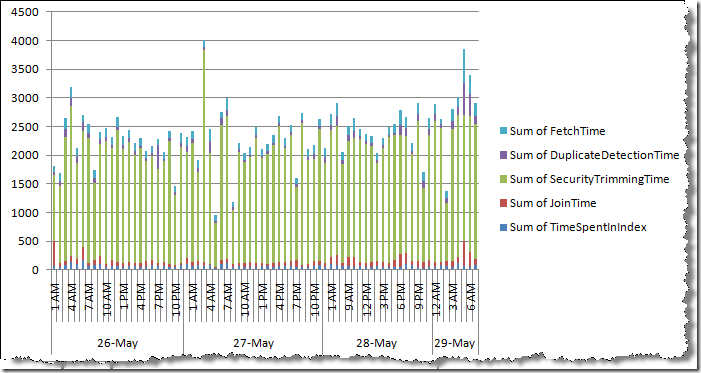
7. Next, let’s change the chart type from line to stacked bar. This should give us the following
8. Next, let’s modify the legends to Avg instead of Sum. Also, we’re going to move the legends below the graph for easier viewing, and fix it up with some titles. What we’re left with is a lot more readable :-)


