Exchange 2007 Memory usage and helpful troubleshooting tips
In support, we get a lot of statements stating that Exchange is using all or most of the memory on a given server. Some may say that is a bad thing, but for Exchange 2007 that is actually a good thing. In this blog, I would like to explain some of the misconceptions of Exchange’s memory usage with relationship to overall/allocated memory and the Paging file and it’s usage. I previously blogged about Exchange 2007 memory usage at Understanding Exchange 2007 Memory Usage and its use of the Paging File, but it appears that more clarification is needed in this area. I am also going to show some real world screenshots of customers actual perfmon log files that show good and bad behavior and how this might help you in troubleshooting what type of a memory issue you might have, if any.
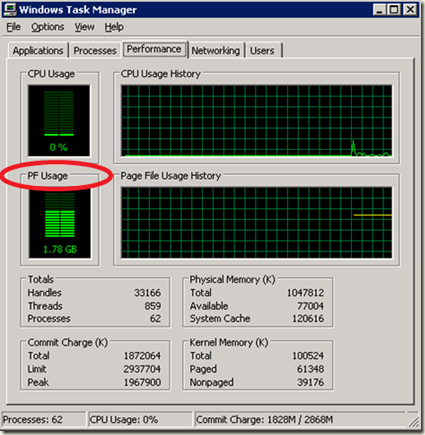
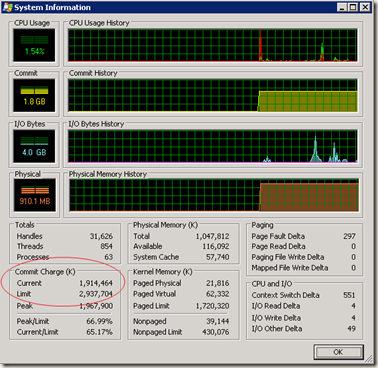
So let’s start with the paging file and it’s usage as that appears to be a common question that comes up all of the time. Some of the questions stem around PF Usage in Task Manager as shown below on a Windows 2003 server and server monitoring software reporting this as a problem. PF Usage in Task Manager is the total number committed pages in the system. This is not how much is currently being used, it is merely the amount of page file space that has been allocated should the OS need to page out currently committed bytes
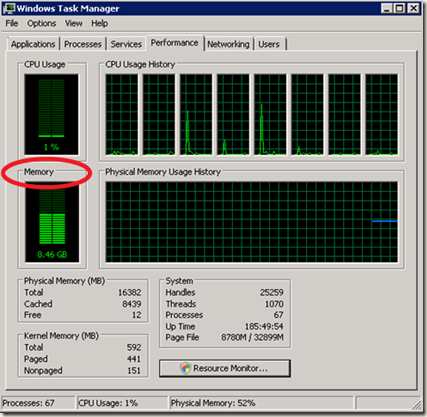
In Windows 2008, Task Manager now shows different terminology as PF Usage has been removed and has been replaced with just the word Memory
There are other counters that show PF usage as well, one is Paging File\% Usage which shows overall usage and Process\Page File Bytes which shows per process Page file allocation. The % Usage counter is about the same as what Task Manager PF Usage shows. It is just the amount of space that has been allocated should committed bytes need to get paged out and doesn’t indicate if the PF is currently being utilized. Paging File\% Usage is a counter that monitoring software commonly shows that could be a potential problem, but in all reality it might not be. Other factors needs to be looked at other than the amount of page file usage to get a clear indication if there is truly a problem or not.
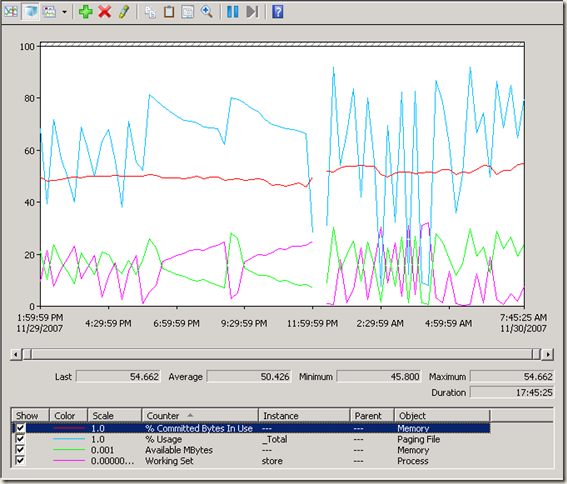
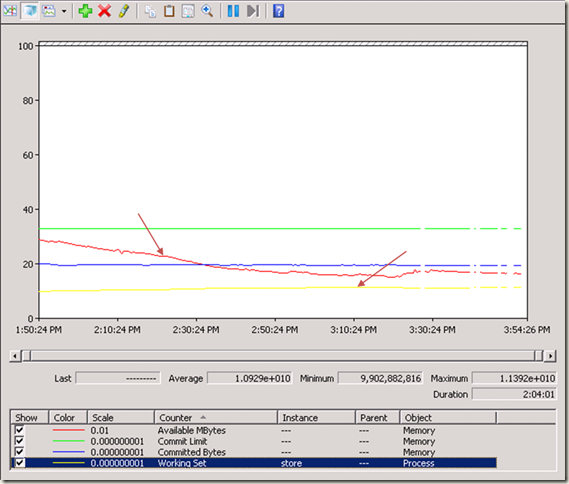
Generally, Page file usage should remain under 80% at all times, but there are times when the OS needs to make use of the paging file and one example is a working set trim operation. The following picture shows an example of this working set trim operation for store.exe where the Memory\% PF Usage shows that we increase the PF usage at the same time the working sets are getting trimmed to satisfy some other application or driver request for allocating a contiguous memory block. You will also notice that PF usage never really bounces back either after something like this happens and remains around a sustained average for the remainder of the server being online or until the server is rebooted. Unless you are getting close to the max Memory\% Committed Bytes In Use, we shouldn’t be too concerned with the PF Usage unless we are seeing some high paging activity going on.
With that said, you would not use PF usage in Task Manager or Paging File\% Usage to determine if the paging file is currently being used. What you would use to monitor this is the amount of Memory\Pages/Sec that are occurring. This counter is a combination of both Memory\Pages Input/sec and Memory\Pages Output/Sec counters which also includes access to the system cache for file based operations to resolve hard page faults. Hard page faults occur when a page from a process is requested but does not exist in memory. This then means that we have to pull that data directly from the paging or backing file. If the page is elsewhere in memory, then this is called a soft fault. These two counters will help you understand if you are writing data (Pages Output) to the Paging file or you are reading data (Pages Input) from the paging file which might be affecting overall Exchange Server performance. Hard Page Faults can result is significant delays in processing data on the server.
Counter Definitions Memory\Pages/Sec
- Pages/sec is the rate at which pages are read from or written to disk to resolve hard page faults. This counter is a primary indicator of the kinds of faults that cause system-wide delays. It is the sum of Memory\Pages Input/sec and Memory\Pages Output/sec. It is counted in numbers of pages, so it can be compared to other counts of pages, such as Memory\Page Faults/sec, without conversion. It includes pages retrieved to satisfy faults in the file system cache (usually requested by applications) non-cached mapped memory files.
Memory\Pages Input/sec - Pages Input/sec is the rate at which pages are read from disk to resolve hard page faults. Hard page faults occur when a process refers to a page in virtual memory that is not in its working set or elsewhere in physical memory, and must be retrieved from disk. When a page is faulted, the system tries to read multiple contiguous pages into memory to maximize the benefit of the read operation. Compare the value of Memory\\Pages Input/sec to the value of Memory\\Page Reads/sec to determine the average number of pages read into memory during each read operation.
Memory\Pages Output/Sec - Pages Output/sec is the rate at which pages are written to disk to free up space in physical memory. Pages are written back to disk only if they are changed in physical memory, so they are likely to hold data, not code. A high rate of pages output might indicate a memory shortage. Windows writes more pages back to disk to free up space when physical memory is in short supply. This counter shows the number of pages, and can be compared to other counts of pages, without conversion.
Recommended guidance states that the size of the paging file should be RAM+10MB for optimal performance and should be of static size and not system managed. Having a paging file set to system managed could cause page file fragmentation which could affect performance in memory pressure conditions, but Exchange generally should not be making use of the paging file for normal operations. If virtual memory is shown to be problematic or high due to other applications on the servers requiring it, you can increase the size of the paging file to RAM * 1.5 to help alleviate some of this memory pressure on the server to help back all of the committed pages in memory. If you are still having problems at this point, check for potential memory leaks within the processes on the server.
High paging in excess of 10,000/sec or more could indicate severe memory pressure or a working set trimming problem that I talked about previously in https://blogs.technet.com/mikelag/archive/2007/12/19/working-set-trimming.aspx.
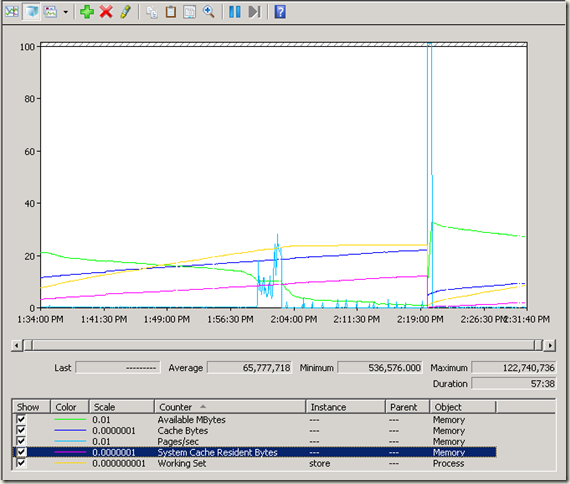
The amount of available memory is another question that comes up regularly. The main performance counter to monitor for available memory is Memory\Available MBytes. This is the amount of physical memory that is available for process or system use. It is the sum of Free, Zero, and Standby (cached) page lists. If you are on a Windows 2008 server and run Process Explorer viewing System Information, you will see these page lists referenced. Available RAM on any given Exchange 2007 server should not go below 100MB. After crossing the 100MB threshold, you are putting your server in a state vulnerable for working set trims when the Virtual Memory manager needs to process a memory allocation request in which sufficient RAM is not available to service that request. Another counter to check to cross correlate why available memory is low is Memory\System Cache Resident Bytes. Memory\System Cache Resident Bytes is part of the overall System cache which is viewable via the Memory\Cache Bytes counter.
The above picture is a depiction of how System cache can affect available memory leading up to a working set trim. Notice in yellow that the Store cache remains consistent prior to the trim, so we know that Exchange did not cause this, but rather some other application. This could be some application making use of the file cache causing this increase. A simple file copy operation of a very large file from this server to another server will cause this problem. You can tame this system cache problem by using the Windows Dynamic Cache service shown at https://blogs.msdn.com/ntdebugging/archive/2009/02/06/microsoft-windows-dynamic-cache-service.aspx. In the above case, it was Antivirus software making use of memory mapped files.
Note: If available RAM is about 100MB, please do not RDP in to the server and fire up the EMC for administration purposes. This will exhaust all RAM on the server and cause working set trim issues. Got to love that one, eh?
Next, I would like to talk about Committed Memory. There are two main counters that I look at when troubleshooting memory related issues to determine if we are truly running out of memory on a server. These counters are Memory\Committed Bytes and Memory\Commit Limit.
Memory\Committed Bytes is the amount of committed virtual memory, in bytes. Committed memory is the physical memory which has space reserved on the disk paging file(s). This counter displays the last collected value and is not an average.
Memory\Commit Limit is the amount of virtual memory that can be committed without having to extend the paging file(s). It is measured in bytes. Committed memory is the physical memory which has space reserved on the disk paging files. There can be one paging file on each logical drive). If the paging file(s) are be expanded, this limit increases accordingly. This counter displays the last collected value and is not an average. The Commit Limit is calculated by taking the amount of total RAM and adding that to the Paging File sizes. This sum will give you your overall Commit Limit on any given server.
There are a few ways to view the current values of the Commit Limit and Committed Bytes. In Task Manager, you could view the Commit Charge (K) area as shown in the above screenshot. You can view these counters in Perfmon, and of course using Process Explorer shown below.
Real World Scenarios
Now that we have all of this knowledge, let’s take a look at some real world examples here.
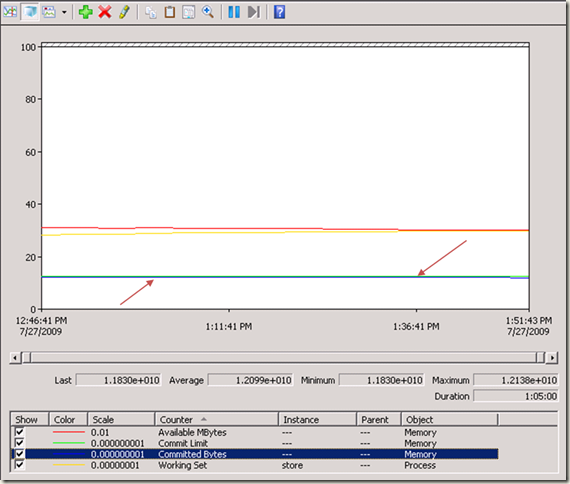
The below picture shows a normal working server where the Store working set remains consistent throughout the lifetime of the store process due to the cache being warmed up or fully populated. This is where you get maximum performance from your Exchange server since you are caching all of the data in memory instead of having to rely on paging information to/from the disks. You will also notice that available memory is just under 2GB. The amount of committed bytes is also no where close to the Commit limit on the server.
The following example shows that our Committed Bytes is just about equal to the overall Commit Limit on the server. Any new memory allocations could be failing causing instability of your Exchange server. This problem was attributed to an incorrectly configured paging file on the server.
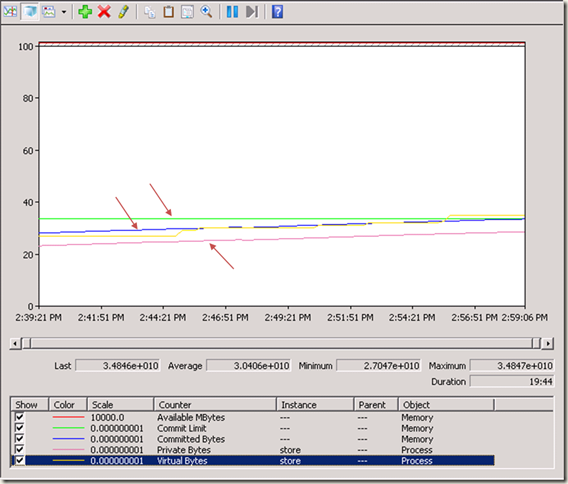
The next example shows an actual Store memory leak. As you can see, the Committed Bytes (blue), Private Bytes (pink) and Virtual Bytes (yellow) for Store is also increasing upward to the overall Commit Limit (green). This occurred due to a recursive operation within the store process exhausting all of the memory on the server. A recursive operation can be thought of a process that is being performed where one of the operations is to repeat the process. This is similar to a loop with no ending or a way to break out of the loop.
I hope this clears up some of the misconceptions behind the command phrase “Exchange is using all the memory”.
Comments
Anonymous
October 26, 2011
Where do you configure the ram usage, My Exchange Server 2007 Used to be using a lot of ram, It has 16gigs, then After updates it just uses 4GIG and the server is performing really bad ;(Anonymous
March 02, 2016
@CBW
You have to use ADSIedit.msc, read here:
http://www.bursky.net/index.php/2012/05/limit-exchange-2010-memory-use/
