Getting Started with Log Parser Studio - Part 3
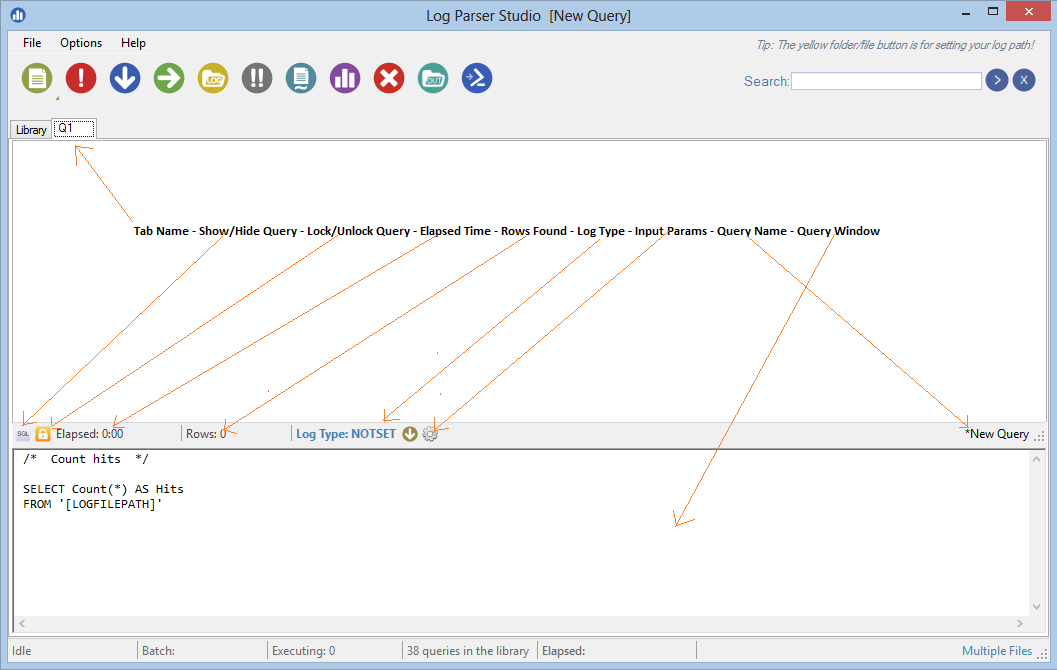
This installment of the Getting Started series is a walkthrough of the query window/editor. This is where you will likely spend most of your time, whether you are simply running queries you have chosen from the library or editing, testing and saving your own queries. Let's start by taking a look at it by double-clicking any query in the library:
Tab Name
The generic name of the tab the query is contained within. To save space (query names would be much too long) these are named sequentially as Q1, Q2, Q3 and so on. You can rename these as needed by right-clicking any tab and choosing "Rename tab".
Show/Hide Query
Shows or hides the bottom query window. This is handy when you are not concerned with making any changes to the query and just want to work with the results grid. The results grid is the top half of the window.
Lock/Unlock Query
Queries loaded from the library are read-only by default. This is a safety net to prevent accidental changes to the query. However, many times you may want to tweak the query and this orange button unlocks it.
Elapsed Time
After the query has been executed this timer displays how long the query has been running (if it hasn't completed) and the total time the query took to complete if it has completed.
Log Type
Log Parser Studio can query multiple log file types such as IIS, CSV, TXT and so on. These are saved with each query but can be changed/selected here. Queries almost always need to match the logs that are being queried.
Input Params
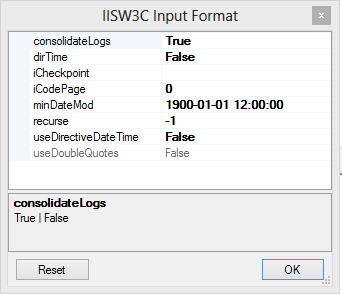
For each Log Type there are multiple parameters that can be set. Typically you won't need to change any of these but if you are an advanced Log Parser 2.2 user you'll be able to make granular changes to how the logs are queried. Warning: Changing these params without knowing exactly what you are doing can cause perfectly good queries to fail and display errors. If for some reason this happens you can easily reset the parameters to their defaults by clicking the reset button as shown below. Additionally, the available params are different for each type of input format (log type). There is also an option in Options > Preferences entitled "Reset all log formats" which will reset all format parameters (both input and output) to their LP 2.2 defaults:
Query Name The full name of the query. If it is a new query it will be "New Query". If the query has been modified it will contain an asterisk in the name: *my modified query
Query Window The actual query itself. Queries follow basic SQL format which will be explained in subsequent posts.
The Results Grid
There is one result grid per query tab. This is where the query results are returned when the query returns the results to LPS instead of a CSV file. The columns are all dynamic and depend on both the query and the fieldnames in the log you are querying. Once the results are returned you can perform several actions:
- Select and highlight cells with colors by right-clicking the selection. These will be lost if you sort or search the grid as an FYI and are only for quick marking of interesting rows/cells.
- Copy selected rows/cells to the Windows clipboard so that you can paste them elsewhere. Hint: Holding CTRL+SHIFT when right-clicking or CTRL+SHIFT+C will copy the cell values only and not the column names. If you exclude this combination you'll also copy the column names to the clipboard.
- Expand/collapse the selected column. Column widths are a default size and do not expand to the width of the contents. Expand/collapse toggles this when you need to see the entire line. The F4 keyboard shortcut also does this for you. Press CTRL+K to see a list of all keyboard shortcuts since there are quite a few of them!
- Search/drilldown existing results. The search box in the top-right of the LPS interface is contextual. Meaning if you are viewing the library, it searches the library, if you are viewing query results it searches within those results. It also searches drill down style meaning each time you search, it only searches the visible rows. This is an important distinction if you have 5000 rows and search for all records containing the word Error which results in 100 rows being found, a new search for the word Failed will only search the latest result. This is very handy for digging into the data without having to run a new query. To display the original full result set, just click the X button by the search box and the original results will appear. Additionally, any grid that is showing searched results will show bluish colored text and the tab will contain a dot by the tab name so that you know it actually contains more records than currently visible. This is also reflected in the chart.
Below we have a query which contained 10557 rows that is now being searched for "logon.aspx" in which were are 250 matches. Also notice I have collapsed the query window since I'm done with the query for now and just want to work with the results.
Actions Bar
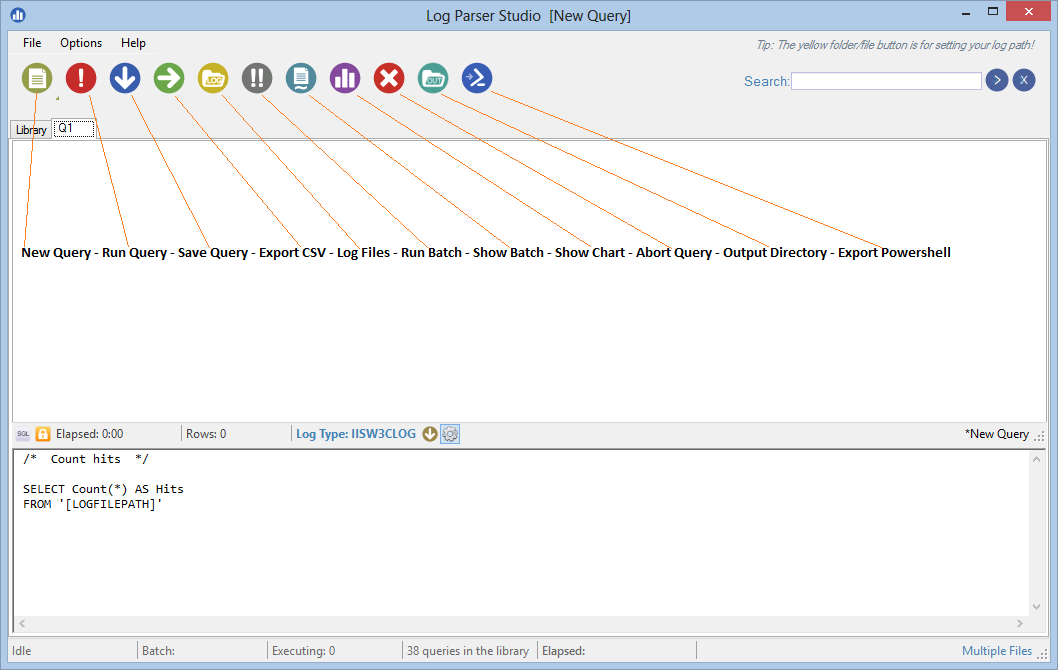
Since the actions bar gets most of its use when working with queries let's display and describe them. To save space they are icons instead of text so the meanings may not be immediately recognizable. When in doubt you can always hold your mouse over a button and it will display its underlying action:
New Query - Creates a new query with the default settings and a log type of NOTSET. You'll need to choose a log type to match the logs you wish to query.
Run Query - This is where the magic happens. Clicking this button will attempt to execute the visible query immediately.
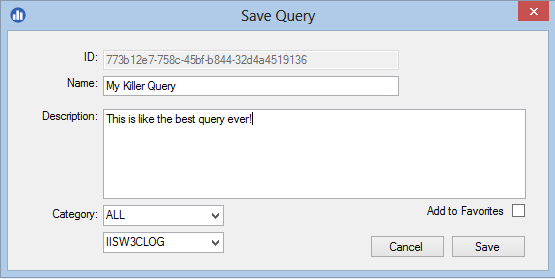
Save Query - Whether a query of your own design or a modified query from the library this button saves the focused query into the library. If you have modified an existing query and want to keep the original you'll want to change the name of the query in the save dialog:
Make the necessary changes above then click save. You will be warned if this action will overwrite an existing query. You may assign a category but be aware that categories may be deprecated in the future. Lastly, if you didn't choose the log type, surely you did and tested the query before saving :) you can set it in the log type drop-down menu above. Once the query is saved it will now show up in the library for future use.
Export CSV - Exports the results of a completed query to CSV format. This simply takes the existing columns and rows and creates a CSV file that you can save to your chosen location.
Note: You can also export to CSV as part of the query itself using the INTO statement leaving the query window only displaying the path to the file that was created. More on this will be covered later. However, here is a quick screenshot of what this looks like so you will be aware. Notice the filename is in blue text and is a link to the actual file. In other words if you click it, the file will open in the default CSV editor. Additionally, there is an option in preferences to auto-open CSV queries when the query completes:
Notice the INTO '[OUTFILEPATH]\CountHits.CSV' line above. This is how you can direct any query you wish to CSV instead of the query window. This is actually a very important concept because the underlying Log Parser 2.2 component is 32bit only. That being the case queries that return very large results can deplete Log Parser Studio's memory when attempting to build the grid that contains all those results regardless of how much memory you have installed on your machine. While we are on the subject there are a few of simple rules we can follow to help avoid this situation:
- Write smart queries. Smart well designed queries rarely return 100,000 rows. In reality a great query that gets you to the answer quickly usually returns a much smaller number of records. That's what queries are for, to tell a story and return the answers you need. If your query is returning too many records you may not be accomplishing much if you now have to wade through 100,000 entrys.
- Use the TOP keyword when writing queries and or existing queries if needed. Notice the above query contains "TOP 100" which limits the results to 100 rows regardless of how many matches were found. Use this if you know the answer you are looking for will likely exist in the "top" returned rows. It can be used in most any query and you can set TOP to any number you wish. Many queries use this for this exact reason. A good example might be a query that returns the TOP 20 users where records beyond 20 aren't important.
- Redirect the results to a CSV file as part of the query which bypasses having to process and build the result grid in LPS altogether. There are two distinct advantages to this. 1) You won't run the risk of running out of memory and 2) the query will finish quicker because there is no need to process all the records and build the grid. See INPUT statement that was mentioned above.
Log Files - This button opens the Log File Manager where you browse for and choose the logs you wish to query. See Getting Started with Log Parser Studio Part I on how to use the Log File Manager.
Run Batch - A batch is a collection of queries that can all be executed at once. You add queries to the batch from the library using right-click > Add to Batch. Since LPS is multi-threaded, all queries will run in the background and you can continue to work on other queries, browse the library etc.
Show Batch - Opens the batch manager window. You can review the queries in batch list as well as execute them directly and save the batch for later use. If you go through all the trouble to choose a batch of queries you run regularly, save some time and save them as a batch. You can return to the batch manager later, load them and run them.
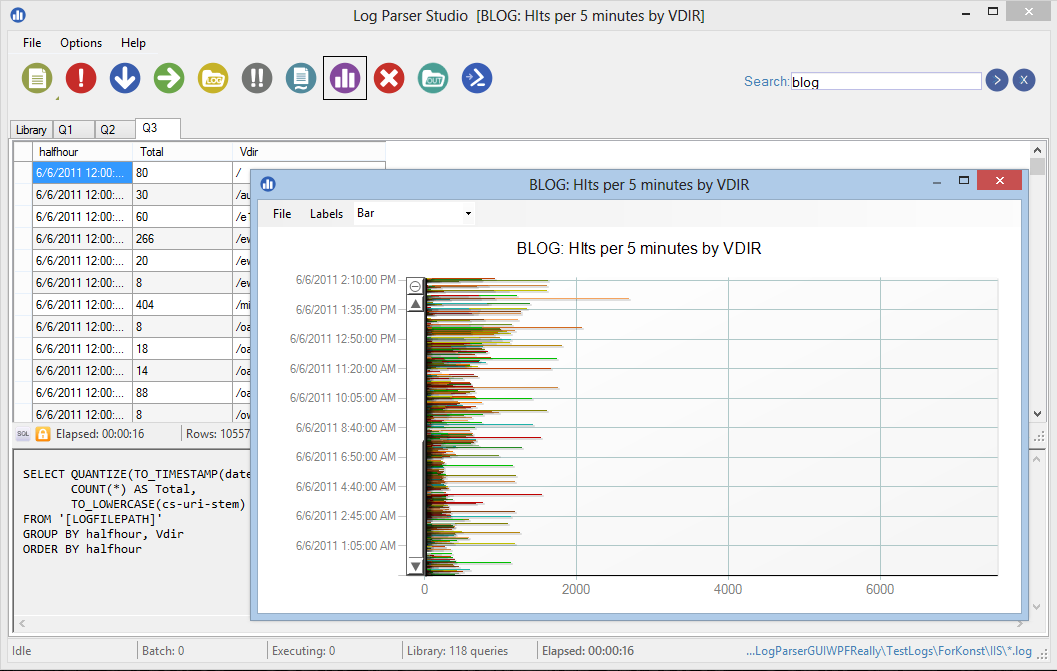
Show Chart - Many queries can be charted. Here is the rule: The chart always gets its axes from the first two columns in the results and the second column must always be some type of number. However, you can drag and drop columns. So if you have a query that for example has a list of dates in column one then ten additional columns with numbers, you can simply drag different number based columns to the column two position and generate a new chart based on those numbers! Charts can also be exported as images, copied to the clipboard, customized, zoomed etc. More on charts in later posts:
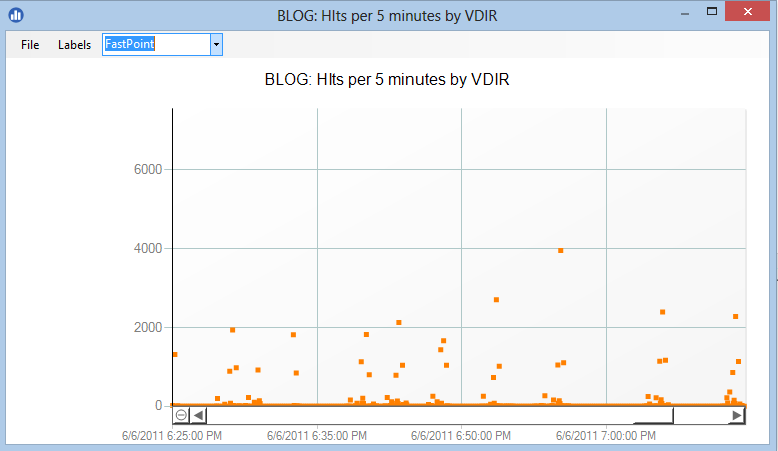
Above we have a query that counts the number of hits to an Exchange CAS server (OWA, EWS, ActiveSync) quantized to 5 minute intervals showing its chart using the charting feature. Charting is a great way to present your findings in a meaningful way to others. Here is the same chart again in a different format:
Abort - The abort button will attempt to abort the visible running query immediately. However, there are lots of moving parts in a multithreaded, multicomponent environment. Once Log Parser 2.2 has the query in the background there isn't much control and it has to do its thing to a point. Basically this means that much of the time the abort button will at least stop the query the first time LP 2.2 calls back to LPS on the background thread. However, in some cases such as using INTO to send the output to CSV LP 2.2 doesn't call back to LPS until the entire query is complete.
Even with these caveats aborting queries has advantages because it clears up the grid so you can make changes and rerun the query, it saves potential memory pressure because the query won't be returned in its entirety etc. In queries that are returned to the grid, if the rows are already being built in the background, only the rows that were actually processed will be returned to the grid. Use the abort button when needed, especially if you just kicked off a query and realized its going to run way too long and return way too many records but don't expect it to be a panacea.
Lastly, when a query has already returned results (IE: the query has finished) the abort button simply clears the grid of any existing rows. So this button actually serves two functions, clear the results grid or abort a running query.
Output - When using the INTO statement to redirect query results to a CSV or other file type. The output directory is where they always go. Click this button to quickly take you to that directory. The query log feature which will be discussed later also sends its output to this directory. The default output directory can be changed at any time in preferences.
Export PowerShell - This button creates a standalone PowerShell script of the selected query (whether selected in the library or the currently focused query tab) . All current settings are exported including input and output query parameters. The PowerShell script does not require Log Parser Studio to execute successfully. It only requires Log Parser 2.2 to be installed on the computer you run the script from. Note that since the script could potentially be executed on machines that do not have Log Parser Studio installed the following changes are automatically made to the script on export:
- All output is by default sent to the My Document folder for the logged in user of the machine they are running the script on.
- Any file tokens are replaced with the actual names. For example '[LOGFILEPATH]' will be replaced with 'file1.log, file2.log' etc.
- You cannot change input/output parameters post export unless you are savy enough to modify the script itself.
There are also are four parameters you can use to modify some behavior when running the actual script:
- -AutoOpen $true/$false - When $true the export file will be opened in the default viewer for the file type. Example: CSV opening in Excel. The default value is $false.
- -OutFIle Filename - Use this to send the CSV file for example to a different location than what was originally indicated in the original query.
- -IgnoreInParams $true/$false - Ignore any custom log type input parameters that were set in LPS and use the LP 2.2 defaults instead. Default is $false.
- -IgnoreOutParams $true/$false - Ignore any custom log type output parameters that were set in LPS and use the LP 2.2 defaults instead. Default is $false.
Here is an example of how to run the query we previously used in the chart example above exported as a PowerShell script. All parameters above are optional. I'm including below just so you can see how they are used when needed:
.\VDirHits.PS1 -AutoOpen $true -OutFile C:\Temp\VDirHits.CSV -IgnoreInParams $false -IgnoreOutParams $false
And finally the query in action:
In this post we covered query window basics along with the actions toolbar going a little more in-depth on what each button does. We learned that smart queries usually don't return very large numbers of rows but if they do we should use the INTO statement to redirect the results to a CSV file. We can abort queries and we can search query results, highlight rows/cells of interest, copy to the clipboard, chart and even export as a PowerShell script for other purposes.
As you can see there is a LOT that can be done with LPS queries and they can be of great help when investigating logs and telling a story. The amazing thing is there is actually a lot more here to know and learn that will greatly expand your power to get at the data you need to get at and present it well including a short course in writing your own queries. Stay tuned because all of it is on the way in future blogs...
Comments
- Anonymous
January 01, 2003
Hi. Thanks for LPS. It has made things easier for me. I have two requests. * Please can you create an article with allowed keywords in the query? * Please can you allow formatting of dates, times & numbers. e.g. if the log file contains dates in US format, please allow me to specify a EU format (same as the CAST command in SQL) - Anonymous
January 01, 2003
Hi, thanks for the feedback, much appreciated. All of the above can be found either in LPS or the original LP 2.2 documentation. For date/time formatting search for "Timestamp Format Specifiers" in Log Parser 2.2 help typically located in C:Program Files (x86)Log Parser 2.2. You can also use time/date format specification with the TO_STRING function also located in LPS and LP 2.2 see below. For allowed keyword/functions etc. just hit SHIFT+F3 in LPS and be amazed. :) You can also find the same in the Log Parser documentation file noted above. Actually, I can't stress enough just how much goodness is contained in the original LP 2.2 help file. The following would convert a date field in an IIS log: TO_STRING(date, 'yyyy-MM-dd') as MyDate - Anonymous
January 01, 2003
thanks for the information! this is really amazing. - Anonymous
August 13, 2015
Kary, thanks for a fantastic product. It saves me a lot of time in my day to day work activities. My team has actually extended LogParser to read in Mediaroom specific ETL files. Is there anyway to use the -i:COM input with LPS?
