Measuring WPF Effect Performance with .NET Framework 3.5 SP1
As I said in the previous post, .NET 3.5 Service Pack 1 addresses issues that were found through a combination of customer and partner feedback, as well as internal testing. Overall, .NET 3.5 Service Pack 1 offers customers many new features and improvements in responsiveness, stability and performance for Visual Studio 2008 and .NET Framework 3.5.
Now…obviously I trust the WPF team , but I was curious to test the “real difference” given from the .NET Framework SP1 (Beta); for the sake of a perf exercise, I’ve written a tutorial to compare the previous BitmapEffect with the new Effect, which is one of the new classes with HW-acceleration support introduced by the SP1.
You can download the source code for this tutorial here. Please remember that, in order to compile the project, you need to install the .NET 3.5 Service Pack 1.
1) Button with Blur Effect
The first sample I’ve created is a Button with a Blur effect.
The Radius property of the Blur effect is bound to a slider, which allows me to change easily its value at runtime.
1: <Button Content="Ciao" x:Name="button" Width="400" Height="150" Grid.Column="1" Grid.Row="1">
2:
3: <!-- FAST, HW ACCELERATED -->
4: <Button.Effect>
5: <BlurEffect Radius="{Binding Path=Value, ElementName=slider}" />
6: </Button.Effect>
7:
8: <!-- SLOW, SW ACCELERATED (deprecated) -->
9: <!--<Button.BitmapEffect>
10: <BlurBitmapEffect Radius="{Binding ElementName=slider, Path=Value}" />
11: </Button.BitmapEffect>-->
12:
13: </Button>
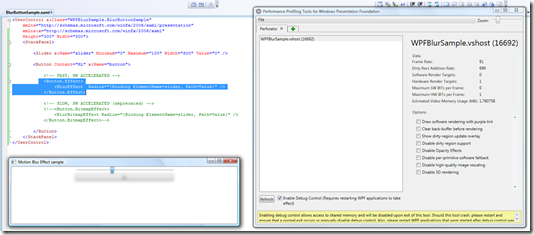
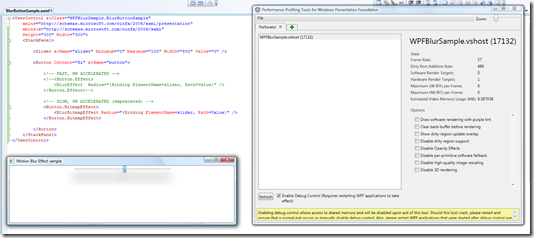
After running and profiling this sample (how-to later in this post), these are my empirical results:
Bitmap Effect (SW Accelerated):
- peek of 8.4 MB video memory usage
Effect (HW Accelerated):
- peek of 1.7 MB video memory usage
Assumptions:
- These results have a "quality meaning" only, since they depends on many factors such as environment/machine hw/memory….
As expected, the Effect is 5 times faster then a Bitmap Effect.
2) StackPanel with Animating Blur Effect
Running the Perforator tool with a slightly more complex sample, the results are stunning: you can see a huge step in the memory usage, from 150MB (sw acceleration) to 16MB (hw acceleration)…an outstanding 1000%!!!
3) HOW-TO PROFILE AND MEASURE PERFORMANCE
I would like to share quickly how I’ve done the previous tests.
- First of all you need to download the Perforator tool, which come as one of the tool in the Performance Suite. Download it here. More info about it here.
- After installing the Suite, you need to run WpfPerf.exe installed in the folder “C:\Program Files\WPF Performance Suite”
- The first time you launch WpfPerf, you will need to select Microsoft.WpfPerformance.Perforator tool from the list, and add it to your console.
- From Visual Studio, create and run (F5) your WPF application.
- Back to WpfPerf, hit Refresh and select the application you are debugging…and voila’, you will have access to some interesting information
These are Snapshots from my tests:
CVD…
These are just easy snippets of code, that don’t really require a lot of memory. However, although simple, they already clearly show some of the performance improvements provided from the .NET Framework SP1 (BETA).
I can’t wait to install the SP1 RTM!!
If you want to try this with your machine, you can download the source code for this tutorial here. Please remember that, in order to compile the project, you need to install the .NET 3.5 Service Pack 1.
Technorati Tags: WPF,C#,.NET Framework 3.5 SP1
Comments
Anonymous
July 06, 2008
When will WPF 3.5 SP1 RTM be available. If you cannot give an exact date, can you tell us whether it is a matter of days, weeks, months or some other useful indication. TIAAnonymous
July 06, 2008
I just got this reply from Brad Abrams blog: <# BradA said on July 6, 2008 5:11 PM: I am not sure we have annonced a date, but it is within the next couple of months.>Anonymous
January 12, 2010
Una delle cose che preferisco del nuovo.but it is within the next couple of months.


