Tracing UAG : don’t be blind ;-)
Tracing a product is always a good thing. First, it helps you to understand how it works internally and so enhance your own skills… second, it helps you to understand why such expected feature or configuration is not working fine.
With IAG (previous version of UAG) we used several technics like registry keys, config files, etc. UAG has been enhanced to concentrate all tracing configuration in one single place.
The base tracing infrastructure of UAG is now Event Tracing for Windows (ETW). A lot of other products in the Microsoft Portfolio use the same technology, including Direct Access (DA).
Tracing configuration, activation and analysis is done via a tool named “…common/bin/tracing/trace.hta" that you run by double clicking "LaunchHTA.vbs ” . You do so in order to get trace.hta to be executed with a certain level of privilege (UAC, ShellExecute with Runas).
Introduction to Trace.HTA
Both client and server side of UAG contains a component named TRACE.HTA. With this GUI, you will configure, start, stop.. and also convert tracing. Then once you get a clear log file you will need to understand and analyze it. Let’s discover this tool.
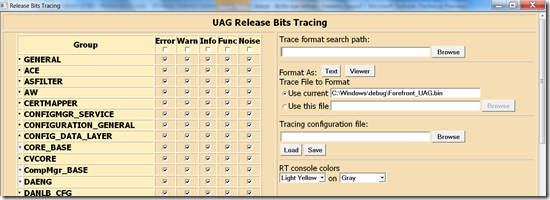
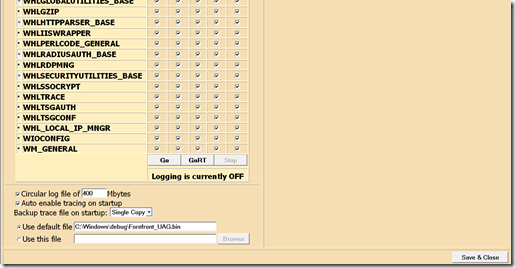
The “height” of this trace.hta page is pretty big, so below you will find 2 screenshots of the interface, one represents the top, the other one the bottom.
The TOP :
The BOTTOM :
Let’s see now how to use this tool, capture and analyze what we get.
Step 1: The capture phase
Tip : because tracing could be very chatty, we try to take this trace 1) when there is no user connected, and 2) “only” the part is causing the problem.
As you can see in the GUI there are button called “GO”, “GORT” (for GO realTime), and “STOP”.
First of all click on STOP to delete any previous trace (by default trace is ACTIVATED on UAG).
Second, you need to tell the tool what you want to trace. As a good start, let’s capture everything. To do so, go on the top of the trace.hta page and click that “Noise” checkbox. If you click the one on the title of the tab, then it will select everything (all components, and the maximum of event).
Third, now you are ready to start the capture. Once you a ready, click the “GO button ” and reproduce the behavior. Once finished, click the “STOP” button and capture is stopped. The result of that process will be a .BIN file, located in the “use default file” field (or elsewhere if you have changed the default configuration).
Let’s see now how to use this BIN file.
Step 2: Install TMF files
Now we have a capture in a format that we can’t read directly. We need to convert that .BIN file into a readable .TXT.
Converting these files requires files called “TMF files”( or more information check this link : https://msdn.microsoft.com/en-us/library/ms797950.aspx). They contain the instructions to convert “binary lines” into understandable “text” lines.
To obtain those files, you need to ask your “Microsoft contact” (presales, support, ... or OEM if you have an appliance). Once you get them, copy them on the UAG hard disk.
Step 3: Convert and analyze
Still in trace.hta, you can now reference the directory of these TMF files in the console, in the “trace format search path” section.
Just click the “TEXT” or “VIEWER” button, and after few seconds (it may take a few seconds, be patient if the capture is big) you will get the result on the screen.
Now the trace is generated… here comes the interesting job... the analysis : Good luck !
Tracing UAG client-side
Both server and client-side of UAG now use the same technology.
In the UAG directory, you will also find a TRACE.HTA (a few options are not the same as Server-Side). You need to run this trace.hta with an administrator level, otherwise you will not be able to START the capture.
Tip : If you want to investigate the workstation analysis part, rather than capturing all kind of event, select this option:
Note: depending on the OS version of the client-side, you will either need to use the 32 or the 64 bits TMF files. If you use the wrong one, you will not be able to decode the capture.
Example: Now that this .bin file is decoded, try to search “Forefront” in the trace.. and you will see what UAG did to detect FCS
Good debug again !
Comments
Anonymous
January 01, 2003
Hi "nb888" For the moment the TMFs are not "published", just drop me a mail and I will give you a link to download it. Hope soon it will be available on technet.Anonymous
March 18, 2010
Nice Article, but where can we find the TMF files because a log with ids isn't very usefull ? BRAnonymous
May 16, 2010
TMF files are now publicly available - read http://blogs.technet.com/edgeaccessblog/archive/2010/05/16/forefront-uag-tracing-is-available.aspx for details


